


 Mini Review
Some Aspects of Meta-analysis Applied in Medical Research
Received Date: February 11, 2020; Published Date: March 05, 2020
Introduction
Meta-analysis is a statistical method to combine the results of multiple scientific experiments conducted in different environments or seasons or places in order to derive a common conclusion about the suitability of the experimental materials throughout the environmental conditions. The conclusion can be drawn by estimating the parameter from the estimates of the parameter obtained from different experiments. The hypothesis regarding the parameter can be verified on the basis of the result of the individual experiment. The common conclusion can be made by combining the test results observed in different experiments. The analysis has the capacity to contrast the results derived from different experiments and to identify the patterns among experimental results in addition to have an estimate of the population parameter [1]. The technique is an important component of a systematic study of the same phenomenon investigated in different agro-climatic / environmental / socioeconomic / hygienic / political conditions.
The historical roots of met analysis can be traced back to 17th century studies of astronomy [2], while a paper published in 1904 by the statistician Karl Pearson in the British Medical Journal [3]. The first meta-analysis was identified in 1940, the book-length publication Extrasensory Perception. After sixty years, the basis of which was the experimental results of conceptually identical experiments.
[4]. The identical experiments are needed in medical science to arrive at decisions affecting clinical practice fostered the momentum toward evidence-based medicine [5-9]. These are also needed in agricultural science to select a best variety of crop or to select a best dose of fertilizer for a particular crop suitable for all agro-cli matic conditions ; in industrial sector, the industrial product is to be produced so that it is demanded by all types of customers from all walk of life in all seasons; in education sector, teaching method is to be suggested so that it will be beneficial for students of all levels of merit, etc. As an example, let us consider the study of the positive effect of a medicine which is suitable, may be in different doses, for all types of people irrespective of age, body condition score and environment. This can be done if the medicine is applied simultaneously and /or subsequently on all types of investigating units. Specifically, the prevalence of diabetes, a component of non-communicable diseases, is observed in all societies and among all types of people irrespective of age and level of obesity. In such a situation, it would be worthy, if one medicine would be discovered for all types of people irrespective of age and body mass index. For this, experiments must be conducted covering all types of people across the country or experiments are to be conducted over a period of time. This latter group of experiments are the retrospective studies which are common in medical science. These types of experiments when conducted, by necessity, may not provide similar results in all experiments. But, from the experimental results a common decision is to be drawn from all the experimental results. This leads the researchers to use the technique of meta-analysis. In near past, there were two meta-analysis [10 -11] in Indian sub-continent and in Bangladesh to estimate the rate of overweight and obesity among children and adolescents. These studies were done in analysing the dichotomous data.
One important aspect of analysis of dichotomous data is to test the association of two qualitative characters by chi-square test. When k sets of dichotomous data are available, k statistics each with (r–1) (c–1) degree of freedom (d.f) are available. When k experiments are independently conducted, the sum of the k Chisquare statistics is also distributed as Chi-square with k (r–1) (c–1) d.f. Hence a common conclusion on the independence of two characters can be made. This is one of the simplest cases of meta-analysis. This method was also proposed by Bhuyan [12]. In doing this type of analysis, a very common measure is the calculation of odds ratio and / or risk ratio. This measure is calculated to estimate the rate of risk of the incidence for a subject when he/she is exposed for the incidence. These ratios are calculated from each of k experimental results and hence a common odds ratio or a common risk ratio is the targeted analysis of the researcher. This is the most common meta-analysis in the field of medicine or biostatistics [13, 10- 11]. The common estimate of odds ratio and risk ratio are shown [ Cochran- Mantel-Haenszel estimate] using the data of k sets of dichotomous data shown below in 2 x 2 contingency table.
A 2 x 2 contingency table for i – th experiment
Here i = 1, 2, ……..., k.
The odds ratio and log of its standard error from i-th experiment are given by
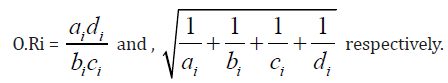
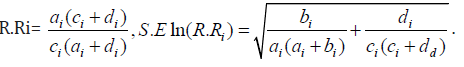
The risk ratio and log of its standard error are given, respectively by
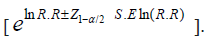
The 100 (1 – α) % confidence interval for odds ratio and risk ratio are, respectively, given by
[eln O.R. Z1 – α/2 S.R ln (O.R)],
The common odds ratio and the common risk ratio are given, respectively, by
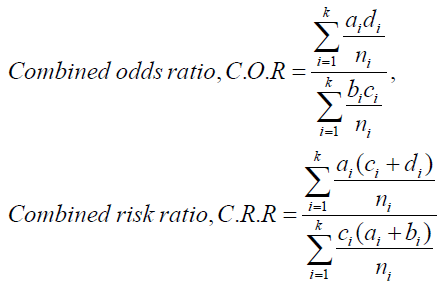
The value of C.O.R. = 1 indicates that the two characters under study are independent. Hence, it needs to test the hypothesis H0: C.O.R = 1 against alternative HA: C.O.R.≠ 1. The test statistic is
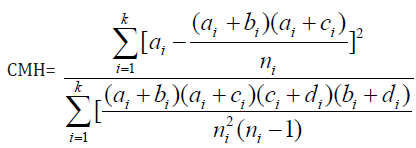
This CMH is known as Cochran- Mantel-Haenszel [13] test and it is asymptotically distributed as Chi-square distribution with 1 d.f. [15].
The analysis discussed above is suitable for discrete data. The dominant method used for continuous data are standardized mean difference estimation. Methods used in meta-analysis for post hoc analysis of findings are relatively specific to meta-analysis and include heterogeneity analysis, sensitivity analysis, and evaluation of publication bias. But all methods need the weighting of studies. Usually, studies are weighted according to the inverse of their variance. The weighted analysis does not create serious problem if fixed effect model is considered for the data. The weighted analysis for combined estimate of effect is biased. But, the bias of order 1/fi can be removed [12], where fi is the d.f. of the i-th experiment when each experiment is conducted assuming completely randomized design or randomized block design. For mixed effect model with treatment effect fixed, the combined weighted estimate of treatment effect is available. Due to the use of estimated weight, the combined estimate is biased one. However, the bias can be removed [12]. But the problem is not obviated in testing the significance of the treatment effect. The approximate analysis was proposed by many statisticians. The important works were done by Cochran, Cochran and Carroll and others [16 -19]. Later on, Bhuyan [12] suggested a method to select a stable group of treatments suitable for all environmental / experimental conditions. The results of the stable group of treatments are to be analysed to have a combined estimate of treatment effect. The test of the significance of treatment effect can be performed for each experiment separately. For common conclusion the p-values of each experiment can be combined according to the suggestion of Fisher [20]. The combined estimate of treatment effect and the common satisfactory decision regarding the significance of treatment effect were also suggested [12].
Some Result of Meta-Analysis
As an example of meta-analysis for odds ratio and risk ratio, let us discuss the results of two experiments presented in Table 1 [21] and Table 2 [22]. Both the data set are related to the study of association of prevalence of non-communicable diseases (NCDs) with residential origin of some adults in Bangladesh investigated in two different occasions by different groups of investigators (Table 1&2).
As a first step of analysis, let us consider the combined odds ratio and combined risk using the data of Table 1 and Table 2. From the first table the value of odds ratio was observed (O.R.)1=2.37 with variance Vln (O.R.)1 = 0.08196. The risk ratio was (R. R)1= 1.23 with variance Vln (R.R)1= 0.00186.The results indicated that rural adults were more than two times exposed to NCDs compared to urban adults. From the second table these results were (O.R )2=1.60 with variance.
Table 1: Distribution of adults according to residence and prevalence of NCDs.

Table 1: Distribution of adults according to residence and prevalence of NCDs.

Vln (O.R)2=0.02201; (R.R)2= 1.24 with variance Vln (R.R)2= 0.006952. It was noted from second study that the rural adults were 60.0 per cent more exposed to NCDs compared to urban adults and their risk for prevalence of NCDs was 24 % more compared to the risk of urban adults. The confidence interval for these odds ratio and risk ratio were [ 0.60,2.93]; [1.15,1.31] and [ 1.32,1.88]; [1.08,1.40].
The objective of both the studies was same but analytical results did not provide the same idea about the prevalence of NCDs among rural people compared to urban people. The problem would be obviated if it would be possible to have a common estimate of odds ratio for a common conclusion using both the data set. The common estimate of odds ratio and risk ratio were given here.
The common estimate of odds ratio and common estimate of risk ratio from both the data set were calculated. These results were O.R = 1.25 and R.R = 1.23. The results indicate that rural adults were 25% more exposed to prevalence of NCDs compared to urban adults and their relative risk is 23% more.
The weighted combined estimates of odds ratio and [12] risk ratio was also calculated, where these ratios were
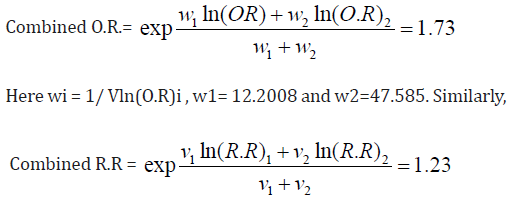
Here vi = 1 / V (R.R)I , v1=538.25 and v2= 143.843.
The test of independence of residence and prevalence of NCDs was performed, where the test statistic was C.M.H.= 21.62 [ p –value = 0.000]. The test statistic indicated that the prevalence of NCDs was not independent of residence. The same conclusion could also be drawn from the individual χ 2 statistics calculated from two sets of data, where χ21 =15.864 and χ22 = 5.779 each with d.f. The common χ 2 = 15.864 + 5.779 = 21.643. It has 2 d.f. [12]. This result indicated that prevalence of NCDs was not independent of residence.
The meta-analysis related to the study of association of two qualitative characters was discussed above. But meta-analysis can be used to study the differences in the values of quantitative variable when values are observed for different levels of one or more qualitative character(s). The data of such type are observed from experiments conducted in completely randomized design or in randomized block design or in any other designs. For example, let us consider the values of body mass index of rural and urban adults [21-22] recorded in two occasions. The objective of the study was to investigate the homogeneity of averages of body mass index for two groups of adults. For this study, let us consider the models for the data recorded in two occasions:
The model is
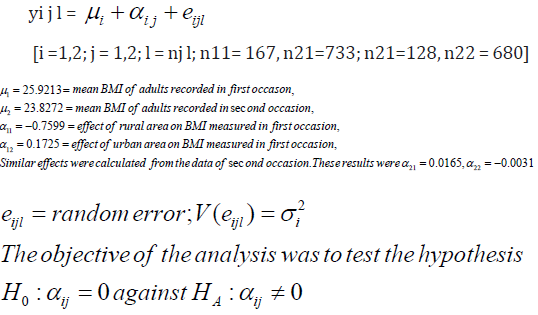
Table 3: ANOVA Table for i = 1.

This is the case of meta-analysis when the experimental data are obtained through completely randomized design. The analysis is simple if 2 2 1 2 σ =σ . For unequal variances, weighted analysis was suggested [12,16 – 19]. One of the methods of analysis for common conclusion on the above hypothesis is to combine [12] the p-values observed from experimental results recorded in different ANOVA Table for i = 1 (Table 3&4). occasions. The results of analysis of variance to test the similar hypothesis for i = 1 and for i = 2 were shown above. From the analysis, it was noted that the effect of residence on BMI was significant in first occasion but insignificant in second occasion. Here the two error variances were heterogeneous as was observed by F-test, where F= 2.13 [ p –value =.0.00]. The common conclusion on the hypothesis of insignificance of residence effect can be made by weighted analysis [12, 16 -19]. However, a common conclusion can be made by combining the pvalues recorded [20] from two analysis. The combined result was χ 2 =14.05 with 4 d.f. ; p-value < 0.01. This indicated that the residence effect was significant (Table 3&4).
Table 4: ANOVA Table for i = 2.

Acknowledgment
None.
Conflicts of Interest
No conflicts of interest.
References
- Greenland SO, Rourke K (2008) Modern Epidemiology 3rd (edn) Rothman KJ, Greenland S, Lash T, Lippincott, Williams and Wilkings.
- Plackett RL (1958) Studies in the history of probability and statistics vii. The principle of arithmetic mean. Biometrika 45 (1-2): 133.
- Pearson K (1904) Report on certain enteric fever inoculation statistics. BMJ 20(2288): 1243- 1246.
- Pratt JG, Rhine JB, Smith BM, Stuart CE, Greenwood JA (1940) Extra-Sensory perception after 60 years: A critical appraisal of the research in Extra-sensory perception, Henry Holt, New York, USA.
- Guyatt GH, Sackett DL, Sinclair JC, Hayward R, Cook DJ, and Cook RJ (1995) User’s guide to the medical literature. IX. A method for grading health care recommendations. Evidence Based Working Group. JAMA 274(22): 1800-1804.
- Sackett DL, Rosenberg WM, Gray JA, Haynes RB, Richardson WS (1996) Evidence based medicine: What it is and what it is not. BMJ 312(7023): 71-72.
- Sangl DK, Berry DA (2000) Meta-Analysis in Medicine and Health Policy. New York, NY.
- Glass JV (1976) Primary, secondary and meta-analysis. Educational Researcher 5(10): 3-8.
- Egger M, Smith GD, Philips AN (1997) Meta-analysis principles and procedures. BMJ 315(7121): 1533-1537.
- Hoque ME, Suhail AR, Doli Munim M, Kurt L, Louis WN, et al. (2014) Prevalence of overweight and obesity among children and adolescents of the Indian sub-continent: A meta-analysis. Nutr Rev 72(8): 541-550.
- Biswas T, Islam A, Islam MS, Pervin S, Rawal LB (2017) Overweight and obesity among children and adolescents in Bangladesh: a systematic review and meta-analysis. Public Health 142: 94-101.
- Bhuyan KC (1985) Combined analysis of a group of experiments with a heteroscedastic model. Sankhya 42(2): 224-232.
- Mantel N, Haenszel W (1959) Statistical aspects of the analysis of data from retrospective studies of disease. J Natl Cancer Inst 22(4): 719-748.
- Cochran WG (1954) Some methods of strengthening the common test. Biometrics 10(4): 417-451.
- Agresti A (2002) Categorical Data Analysis, John Wiley and Sons Inc. Hobeken, New Jersey, USA, pp.231-232.
- Cochran WG (1937) Problems arising in the analysis of a series of similar experiments. Jour Roy Stats Soc 4(1): 102-118.
- Cochran WG, Carroll SP (1953) A sampling inspection of the efficiency of weighting inversely as the estimated variance. Biometrics 9(4): 447-459.
- Cochran WG (1954) The combination of estimates from different experiments. Biometrics 10: 101-129.
- Doi SA, Barendregt JJ, Khan S, Thalib L, Williams GM (2015) Advances in meta-analysis of heterogeneous clinical trials II: The quality effects model. Contemp Clin Trials 45(A): 123-129.
- Fisher RA (1941) Statistical Methods for Research Workers. Edinburgh, UK.
- Bhuyan KC, Fardus J (2019) Level of obesity and socioeconomic factors of a group of adult people of Bangladesh: A factor analysis approach. American Journal of Data Mining and Knowledge Gathering 4(1): 8-14.
- Bhuiyan D, Bhuyan KC (2019) Discriminating Bangladeshi Adults by Level s of NCDs: Unpublished Research Report. South Asia.
-

This work is licensed under a Creative Commons Attribution-NonCommercial 4.0 International License.


