 Review Article
Assessment of the Dependence of Mercury Intake into the Human Body on the Peculiarities of the Human Diet. Estimation of Intake of Small and Ultra-Low Doses of Mercury in the Human Body with Food
AV Gorbunov1, SM Lyapunov1, MV Frontasyeva2*, and SS Pavlov2
1Geological Institute of Russian Academy of Sciences, Moscow, Russian Federation
2Frank Laboratory of Neutron Physics, Joint Institute for Nuclear Research, Dubna, Russian Federation
MV Frontasyeva, Frank Laboratory of Neutron Physics, Joint Institute for Nuclear Research, Dubna, Russian Federation.
Received Date: September 29, 2020; Published Date: October 29, 2020
Abstract
The purpose of this work was to estimate the amount of mercury intake in the human body when consuming the most common food products. The samples were taken on the territory of Russia without reference to the manufacturer in accordance with the principle of random sampling. Samples of basic foodstuffs, agricultural products, freshwater and marine fish were taken. Freshwater fish were caught throughout the Volga River, and samples of the main commercial fish species were selected. The analysis was carried out by instrumental neutron activation analysis and atomic absorption spectrometry with “cold steam”. Based on this analysis, food products with the highest and lowest concentrations of mercury were identified. The amount of food consumed by a person at different income levels, and on average for the regions of Russia, was estimated. The daily intake of mercury into the human body with different diets was calculated and it was shown that 50-60% of the total mercury comes from fish consumption. The accumulation of mercury in the muscles of fish caught in the upper and middle reaches, and delta of the Volga River was estimated. The features of mercury accumulation in the muscles of pike, perch and bream were revealed. A comparison of the actual intake of mercury in the human body with a safe daily dose according to FAO and who, which showed that the intake of mercury during food consumption in Russia is within physiologically safe limits. At the same time, a constant and characteristic intake of ultra-low doses of mercury for the entire population of Russia has been identified, the long-term consequences of which have not been practically studied.
Keywords: Mercury; Ultra-low doses; Food; Diets; Freshwater and marine fish; Accumulation features; Human body; Intake
Introduction
Mercury refers to the number of elements constantly present in the environment and living organisms. It is a highly toxic, cumulative poison that affects the hematopoietic, enzymatic, nervous system and kidneys.
The toxic effect of mercury is highly dependent on its chemical form. Inorganic salts of divalent mercury cause kidney dysfunction, while methyl mercury mainly impairs the peripheral and central nervous system. The excretion of mercury from the body is carried out in various ways, but very slowly: through the gastrointestinal tract (18-20%), the kidneys (40%), the salivary glands (20–25%). According to various estimates, the human body contains 10–15 mg of mercury [1-3].
FAO and WHO set a weekly safe dose of total mercury intake of 5μg, for every kilogram of human body weight, a toxic effect occurs when 0.4 mg / day is taken. As for methylmercury, its toxic effect occurs when the intake of 3.3μg per 1 kg of body weight. At present, the effects of mercury on workers and the public in case of industrial emissions have been studied in considerable detail. This is usually an intense impact, localized in space, time and related to a limited circle of people. At the same time, there is a channel for the entry of mercury into the human body, which is no less important than industrial exposure: this is the intake of mercury with food consumed. Every day a person consumes an average of 1.2-1.8 kg of various foods.
Each of these products contains a certain amount of mercury; therefore, the entry into the human body of low doses of mercury is widespread and applies to absolutely the entire population of Russia. Information on the level and amount of this release is almost completely absent, and there is also no monitoring of mercury concentrations in food. Given the fact that mercury is extremely slowly excreted from the body, the accumulation of this metal in various human organs is possible due to simple consumption of food. Therefore, the purpose of our research was to determine the concentration of mercury in the most typical food for Russia and to assess its level in the human body through the consumption of these products. Sampling was carried out from the retail network in the cities of the European and Asian parts of Russia.
Sampling was carried out without reference to the manufacturer - the company in accordance with the principle of random sampling (just as in most cases, the purchase of products by the population). Samples of food, sea fish and seafood were selected in the retail network of years. Moscow, Podolsk, Kaluga, Gus-Khrustalny, Arkhangelsk, Sochi, Khanty-Mansiysk, Khabarovsk and Vladivostok. River fish was partly taken from the retail network, partially caught in the rivers of the European part of Russia –Oka, Moscow, Sturgeon, Volga and Akhtuba rivers. Each type of food was taken in a total of 5–20 samples. In total, about 1000 individual samples were selected. Food samples were taken in zip-lok plastic bags; in the case of long-term transportation, deep freezing was carried out at a temperature of -200°C (Table 1-3).
Table 1: Shows the concentration of mercury in staple foods. All concentrations of microelements are given based on the moisture content of the product. The data show that an increased concentration of mercury is characteristic of non-milled grains (wheat and rye), some by-products (lung and kidney), sea and river fish.
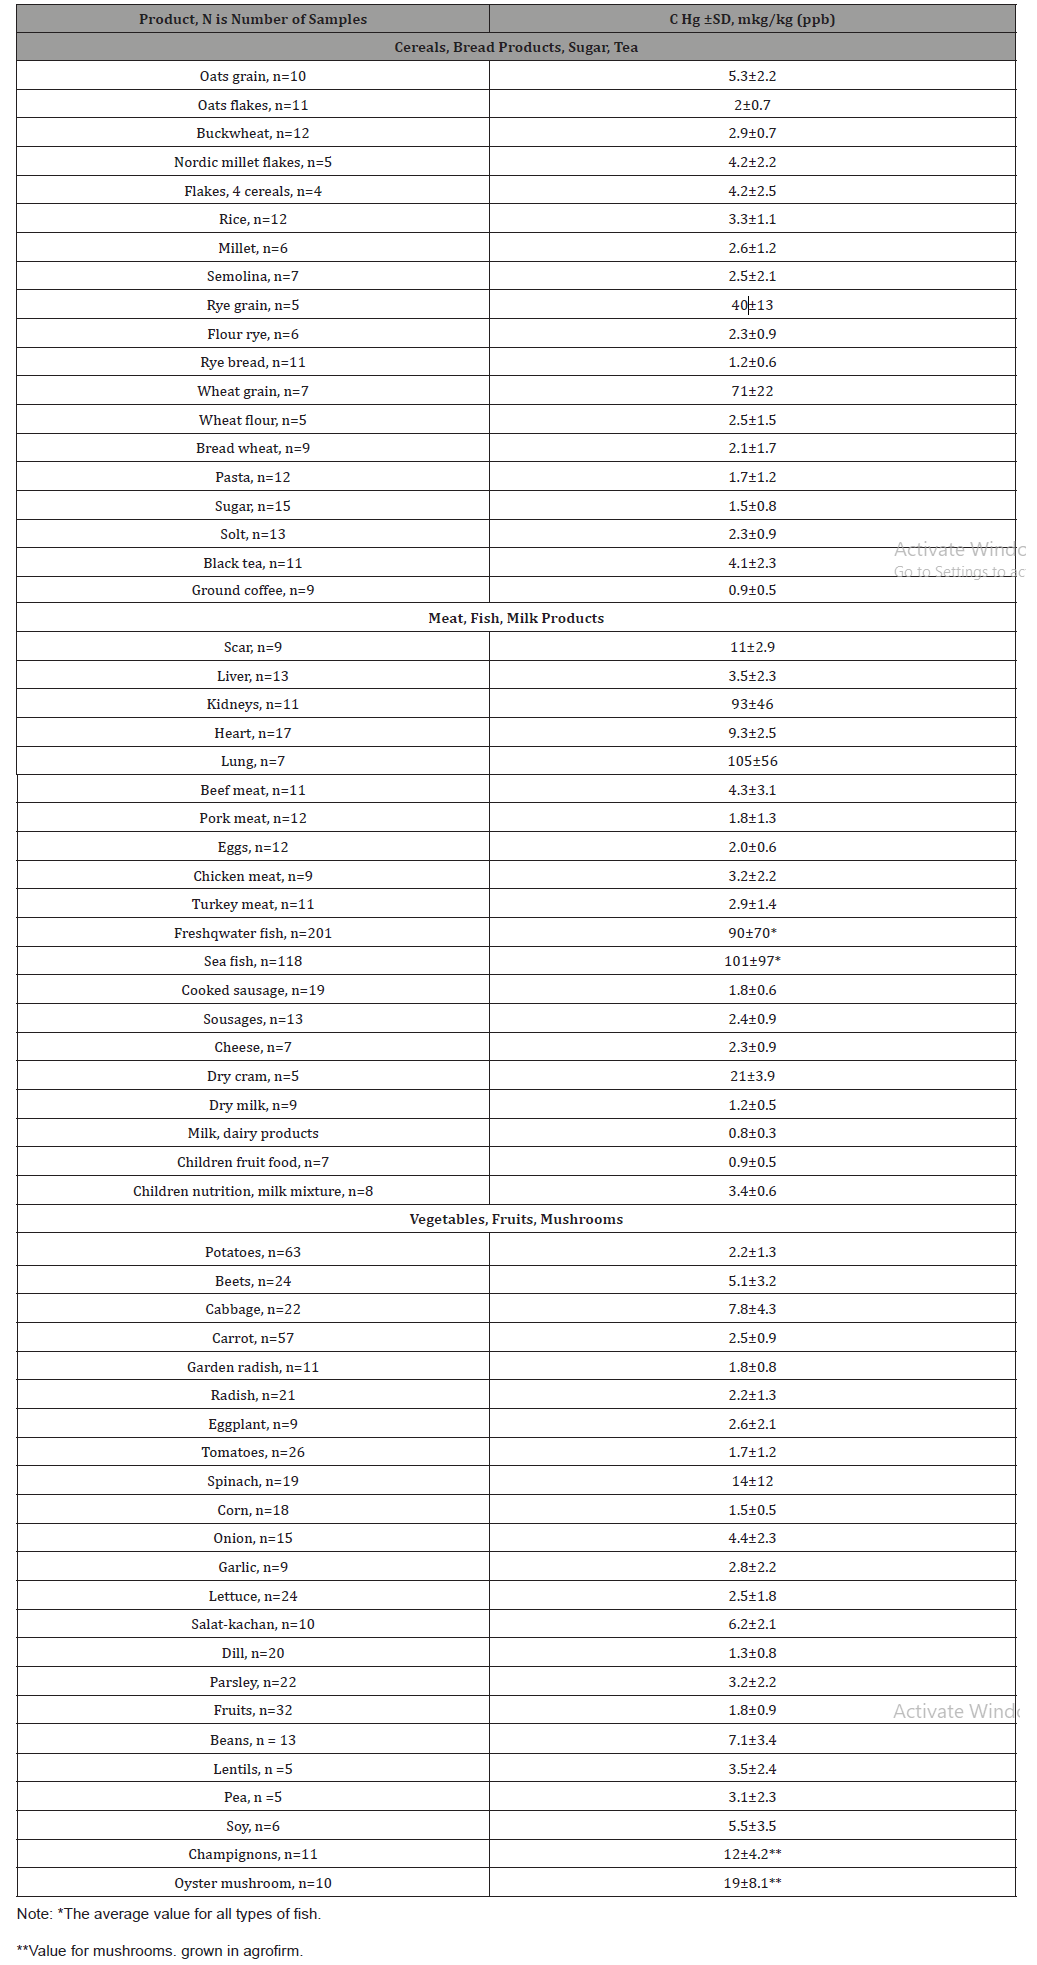
Table 2: Comparison of these data with MPC (Table 2) shows that in grain wheat and rye the standard is exceeded by 2−3 times. It should be noted that this applies only to the grain, in the finished product -flour and bread-the concentration of mercury is within the MPL.
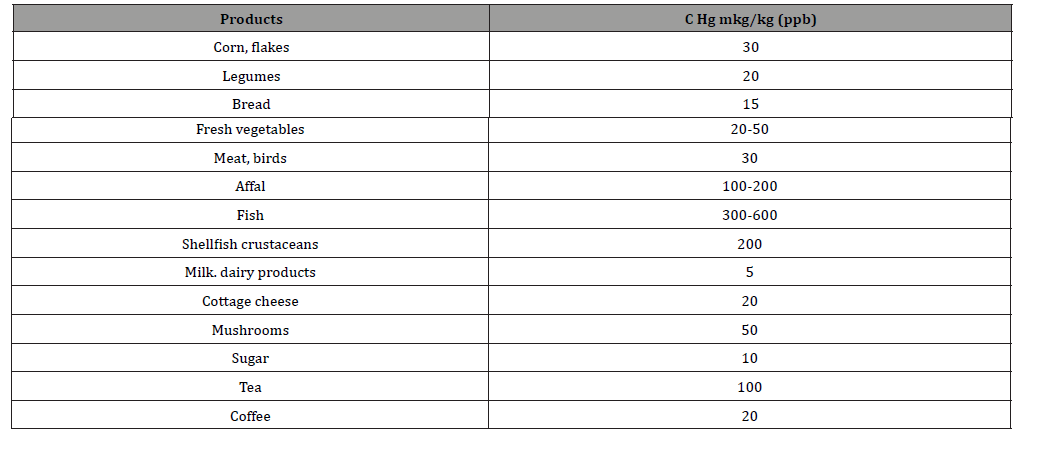
Table 3: Consumption of basic foodstuffs per capita, depending on the amount of income and region of residence kg/year [4-7].
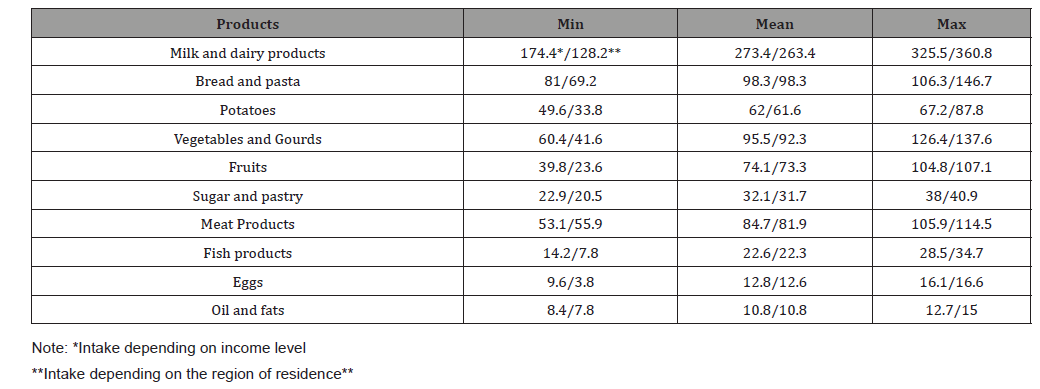
The structure and volume of food consumed is determined by the human diet. Of course, the diet of each person (family) is largely individual, however, in general, it comes down to a set of basic foods, the amount of consumption of which depends on two main factors: income level and region of residence. Table 3 shows statistical data on the consumption of basic foodstuffs in Russia, depending on the income of the population and region of residence. Using this data and the data on mercury concentrations in food given in Table 1, it is possible to calculate the intake of mercury into the human body with each of the rations given in Table 3. Using the data of Tables 1 and 3, we calculated the amount of mercury in the human body when the main food products in Russia were consumed at different income levels, and also depending on the region of residence. The results of these calculations, as well as the calculated share of fish and fish products in the total intake of mercury into the human body are shown in Table 2.4. As noted above, the safe intake of mercury is 5 μg per 1 kg of a person’s body weight per week, which is 50 μg per day.
The data presented in Table 4 show that the actual intake of mercury into the human body in Russia with food (line 1) is significantly below the toxic threshold accepted by FAO and WHO. At the same time, it is necessary to recognize the fact of the constant low-dose intake of mercury in the human body while consuming the most common foods. This influx occurs throughout a person’s entire life, causes the accumulation of mercury in human tissues and organs, and concerns the entire population of Russia. The consequences of this accumulation, as a result of the constant exposure to low doses of mercury, are clearly not enough investigated and need further study.
Of particular interest to study is the assessment of the proportion of fish and fish products in the total volume of mercury that enters the human body with food. It is known that many researchers mainly associate low-dose exposure to mercury with regular consumption of fish and seafood [8-10]. Some papers [11,12] also provide evidence that the regular consumption of fish and seafood leads to an increased concentration of mercury in the hair and cord blood of pregnant women. Row 2 of Table 4 shows the contribution of fish and fish products to the total intake of mercury in the body with food. These data show that the contribution of fish and seafood to the total intake of mercury in the human body is decisive and ranges from 50-60% [13,14] (Table 4).
Table 4: The entry of Hg into the human body with basic foods [15].

The intake of mercury in the human body due to the consumption of fish and seafood in various regions of Russia. The level of mercury in the human body depends on many factors: the presence of a mercury deposit or chemical production in a given area, the presence of a Termo Power Plant, solid waste landfills or mercury waste disposal sites. In the domestic environment, the main sources of mercury are fluorescent lamps and mercury thermometers. However, for most regions of Russia, these sources are either absent (as in the case of deposits) or lead to localized localized pollution. Therefore, at present, some researchers consider the main way for mercury to enter the human body to be its consumption with food, in particular with fish and seafood [14,16,17,18].
The accumulation of mercury in fish and seafood is directly dependent on the intake of mercury in water bodies and is due to both natural and anthropogenic factors. After entering the water body, mercury conversion occurs [20] in three main directions: it is restored to the elementary state and disappears into the atmosphere; forms strong insoluble compounds (sulfides) and is deposited in the bottom sediments; sorbed on the surface of bacterial membranes and goes into the organo-mercury compound (methylmercury).
Methylmercury accumulates in aquatic organisms-plants, benthos, animals, and ultimately concentrates in the upper links of the food chain -fish. There is also evidence that the content of mercury in predatory fish is several times higher than in the objects of its food [19,20,21]. The aim of the study was to assess mercury intake from fish and seafood consumption in different regions of Russia.
Fish was purchased from retail chains in various cities of the European and Asian parts of Russia. This sampling was carried out without being tied to the producer company in accordance with the principle of random sampling (just as the population purchases fish and seafood). Samples of sea fish and seafood were taken in the retail network of Moscow, Podolsk, Kaluga, Gus-Khrustalny, Arkhangelsk, Sochi, Khanty-Mansiysk, Khabarovsk and Vladivostok cities. River fish was partly taken from the retail network, partially caught in the rivers of the European part of Russia -Oka, Moscow, Sturgeon, Volga and Akhtuba rivers. Samples were taken in zip-lok plastic bags, cleaned of external contaminants and washed with distilled water. For long-term transportation, samples were frozen at -200 °C.
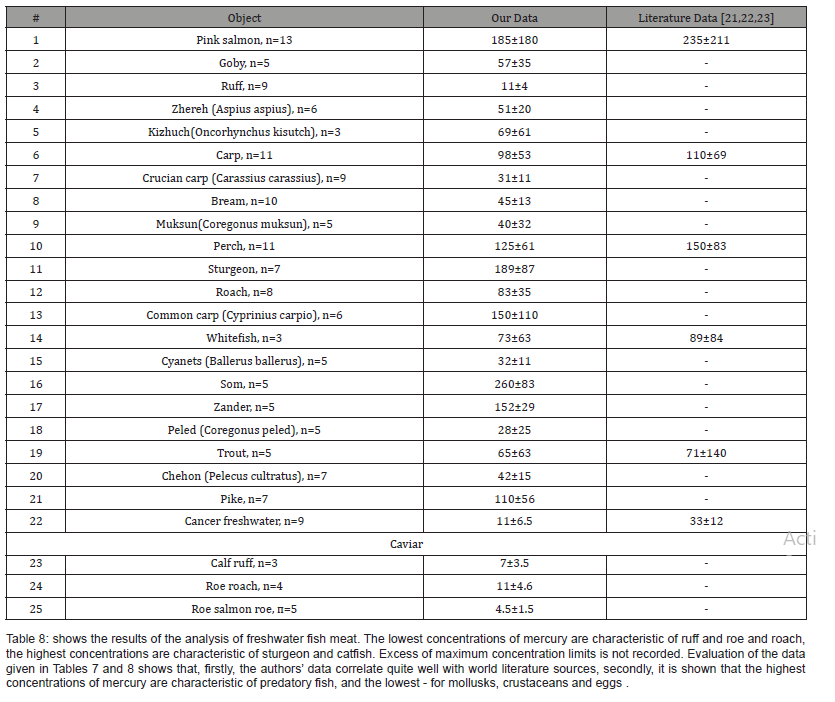
Drying and grinding of samples was not carried out; samples were taken for analysis with a natural percentage of moisture. A general list and number of samples of fish and seafood products are shown in Table 5. The Food and Agriculture Organization of the United Nations (FAO) and the World Health Organization (WHO) set a weekly safe dose of total mercury 5 μg (for methylmercury 3.3 μg) per kilogram of human body weight. In the human body, according to various estimates, contains 10–15 mg of mercury, a toxic effect occurs when receiving 0.4mg/day. Table 6 shows the values of the maximum permissible concentrations (Mercury) accepted in the Russian Federation for various types of fish and fish products [22] (Table 5-8).
Table 5: List of samples of fish and seafood (n is number of samples). # Type
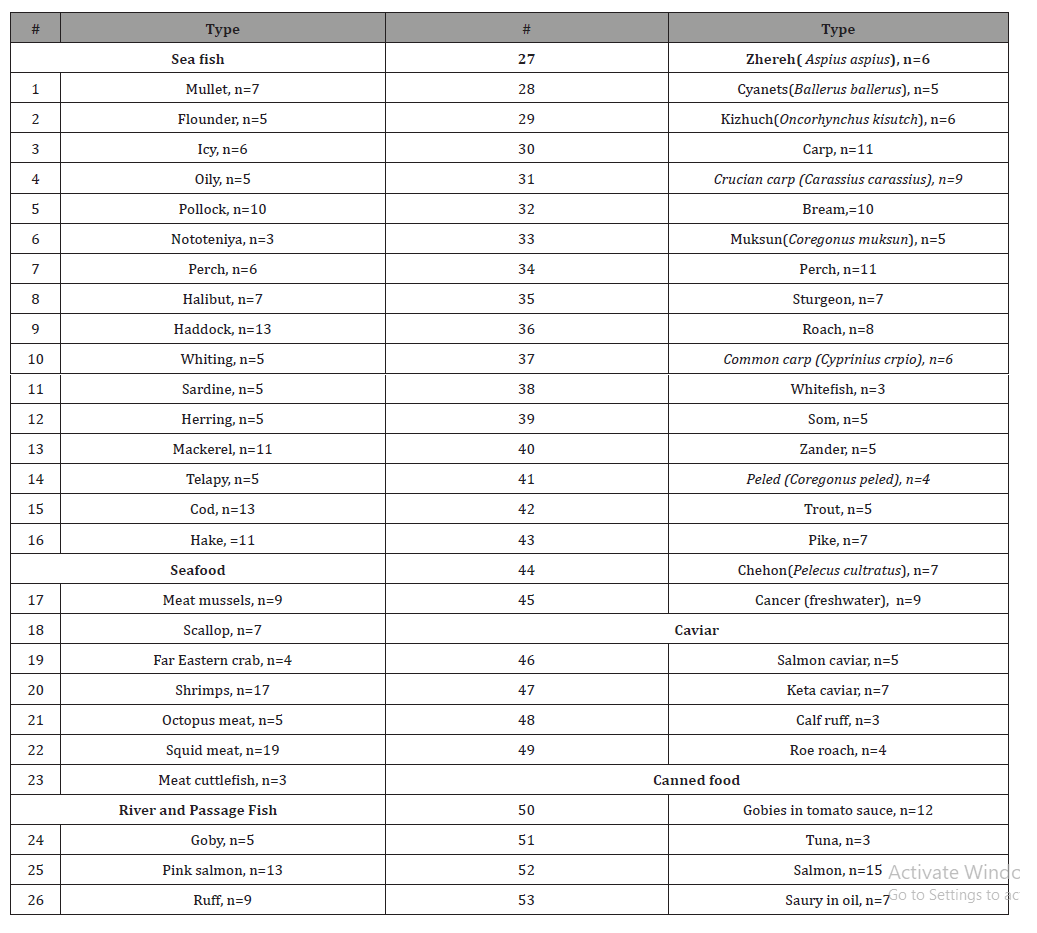
Table 6: MPL of mercury in fish and seafood.

Table 7: Hg concentration in marine fish, canned food and seafood, mkg/kg (ppb) (n is the number of samples)
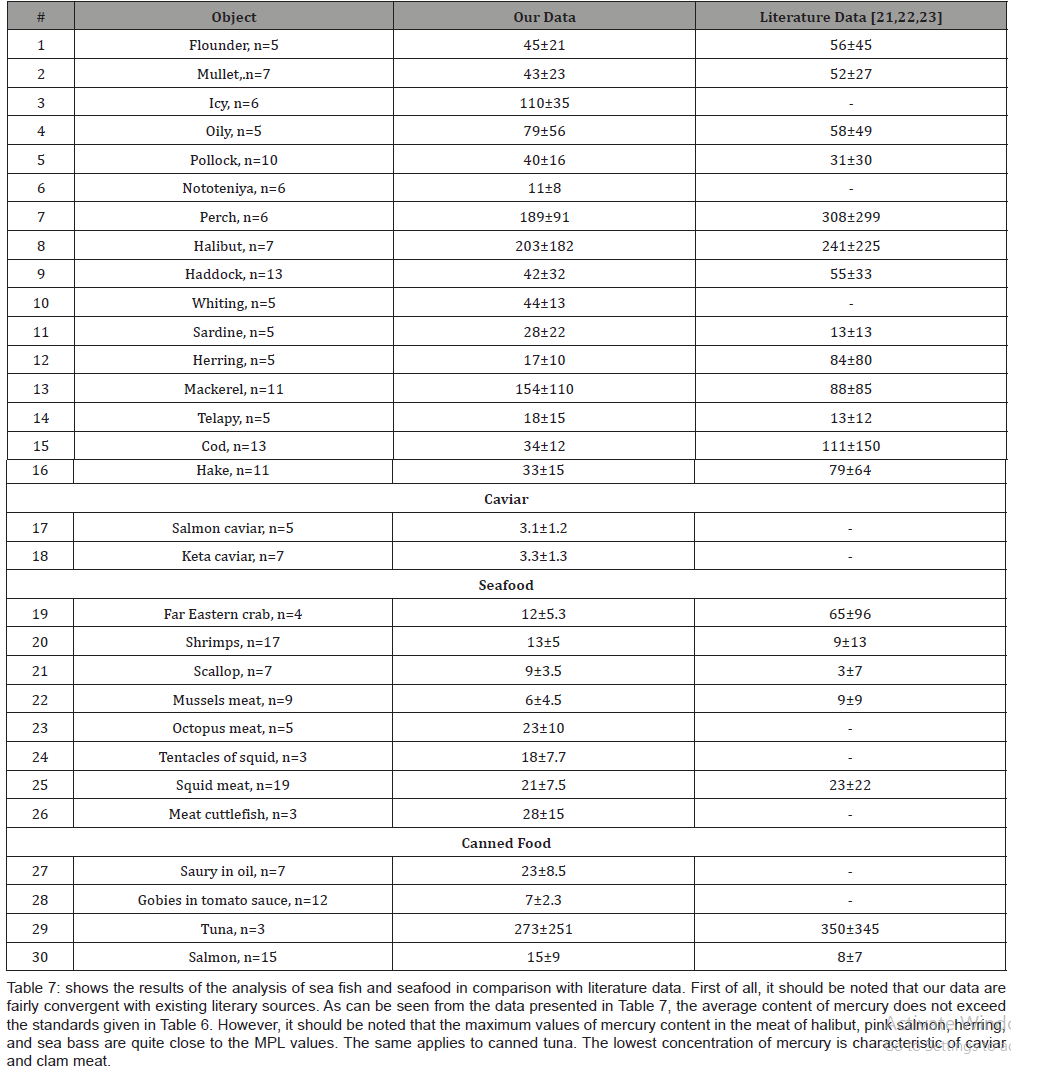
Table 8: Concentration of Hg in freshwater and passing fish. mkg / kg (ppb), (n is-number of samples).
The level and structure of fish and seafood consumption depends on many factors: region of residence, availability of these products in the distribution network, income level of the population, mentality and adherence to traditional diets. On average, in the Russian Federation, fish and seafood occupy 2.5–3% of the total food supply of the population [4-7]. Table 9 presents data on the structure and annual consumption of fish and fish products in various regions of Russia (Table 9).
Table 9: The structure and volume of consumption of fish and seafood in various regions of the Russian Federation [4-7].
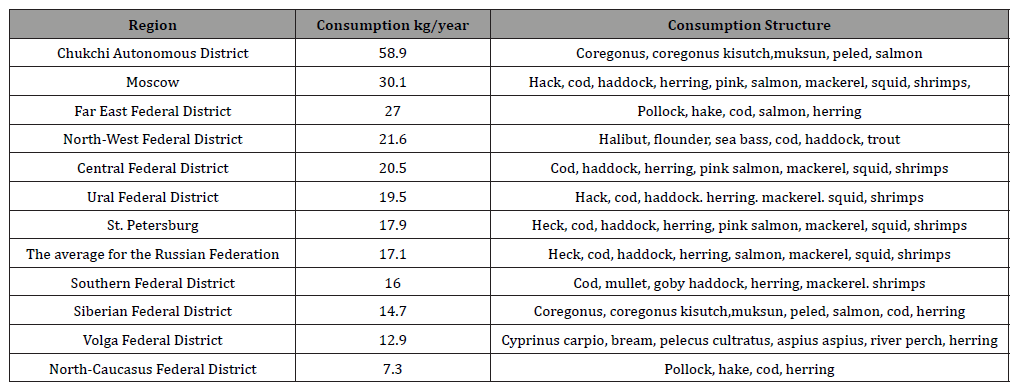
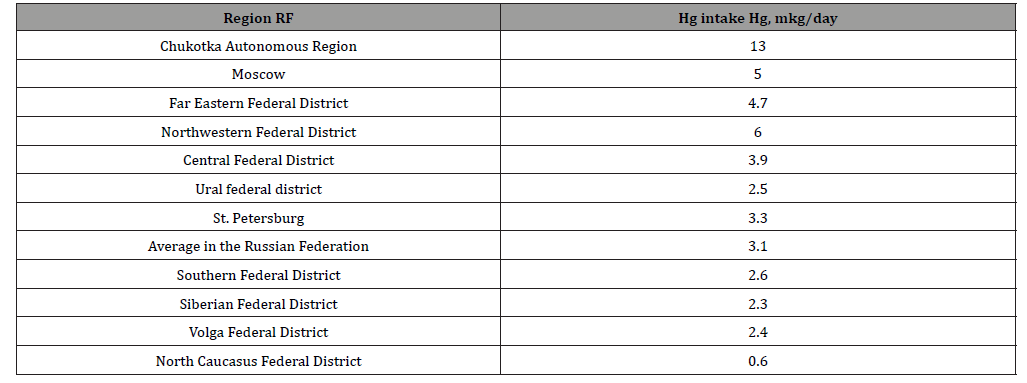
Table 10: Intake of Hg in the human body with fish and seafood in various regions of the Russian Federation.
The calculation of mercury intake into the human body was carried out using the data given in Tables 7, 8, 9. The calculation was carried out according to the formula:
V = P × Cav,
where V is mercury intake in the body, mcg / day; P is the volume of consumption of fish and seafood, kg/day (Table 9); Cav is the arithmetic average of mercury concentrations in the total fish consumed, mkg/kg (using data from Tables 7, 8, 9). The value of P was recalculated from the value of kg/year to the value of kg/day. The Cav value was calculated taking into account the consumption structure in this region (Table 9) and mercury concentration in each specific type of fish consumed (Table 7, 8). For example, in Moscow, according to Table 9, mainly hake, cod, haddock, herring, pink salmon, mackerel, squid, shrimp are consumed. The concentration of mercury in these types of fish and seafood is given in Tables 7 and 8. For ease of calculation, it was assumed that these species of fish and seafood are consumed by the population in equal shares. In this way:
Cav = (C1 + C2+ ... ..Cn)/n
Table 10 shows the results of the calculation of mercury intake into the human body during the consumption of fish and seafood in various regions of Russia. As already shown above, 5μg per 1 kg of weight is considered a safe weekly dose of mercury in the human body. In terms of a person’s average weight of 70 kg and daily intake, a safe dose of 50 μg/day was obtained (Table 10).
The data presented in Table 10 show that in no region does mercury enter the human body when consumed with fish and seafood exceeds a safe dose. Moreover, in most regions, the actual intake of mercury with fish and seafood is 10 to 20 times lower than the safe threshold.
Conclusion
• Mercury concentration in the bulk food products on the territory of Russia is within the MPC. The highest concentration of mercury is typical for non-ground grains, some offal (lungs, kidneys), as well as meat of freshwater and oceanic fish. The intake of mercury into the human body during food consumption in Russia is generally within the physiologically acceptable limits and does not exceed the toxic threshold;
• at the same time, it should be recognized that there is a constant low-dose intake of mercury in the human body when using the Most common food products. This influx occurs throughout a person’s life, causes the accumulation of mercury in human tissues and organs, and affects the entire population of Russia, regardless of income and region of residence. Mercury is removed from the body very slowly, so there is a risk of cumulative accumulation of mercury in the body. The consequences of this accumulation, as a result of constant exposure to small doses of mercury, are clearly insufficiently studied and need further study;
• the share of fish and fish products in the total intake of mercury in the human body has been established – it is decisive and amounts to 50-60%. This refers to the current level of consumption of fish products and increased consumption or changing consumption patterns (towards increased consumption of predatory pelagic fish), will increase the share of mercury.
• the concentration of mercury in the muscles of all fish species presented in the work does not exceed the accepted standards (MPC). The highest mercury concentration is typical for carp, carp, walleye, pike, perch, sturgeon and catfish, the lowest mercury concentration is for ruff and crayfish. It was found that the concentration of mercury in caviar is minimal and does not depend on the concentration of mercury in the muscles of fish
Acknowledgement
Authors express their gratitude to GA Granovskaya (GIN RAS) for help in experimental investigations
Conflicts of Interest
No conflicts of interest.
References
- Petrosyan VS (2007) Global environmental pollution with mercury and its compounds. Russia in the world around us: 2006, M MNEPU, Avant, pp. 149-163 (in Russian).
- AV Gorbunov, SM Lyapunov, OI Okina, MV Frontasyeva, SS Pavlov (2012) Nuclear and Related Analytical Techniques in Ecology: Impact of Geoecological Factors on the Balance of Trace Elements in the Human Organism. Physics of Particles and Nuclei 43(6): 783-824.
- Addendum for Organic Mercury Compounds (2013) (Alkyl and Dialkyl Mercury Compounds) Supplement to the 1999 Toxicological Profile for Mercury. Agency for Toxic Substances and Disease Registry Division of Toxicology and Human Health Sciences Atlanta, GA 30333 143.
- Vtorushina AV (2011) Regional features of the formation of a consumer society in Russia: analysis of the structure of nutrition. J Sociology and social anthropology 5(58): 252-259.
- Analysis of the food consumer basket of the Russian Federation in 2012-2013. Analytical report, TEBIZ Group.
- Gershonkov AM, Merkulova E Yu (2014) Analysis of the consumption of basic food products by regions of the Russian Federation. Socio-economic phenomena and processes 9(11): 54-63.
- Official site of the Federal Statistics Service. Gorbunov AV, Lyapunov SM, Okina OI, Frontaseva MV, Pavlov SS, et al. (2015) Nuclear-physical analysis methods in medical geology: assessment of the impact of environmental factors on human health. Physics of Particles and Nuclei Т 46№3С 424-451.
- Gorbunov Anatoly V, Ermolaev Boris V, Lyapunov Sergey M, Frontasyeva Marina V, Pavlov Sergey S (2016) Estimation of Mercuri Intake from Consumption of Fish and Seafood in Russia. Food and Nutrition Sciences 7: 516-523.
- Passos CJ, Mergler D, Lemire M, Fillion M, Guimaraes JR Fish consumption and bioindicators of inorganic mercury exposure. Sci Total Environ 373(1): 68-76.
- Egorov AI, Ilchenko IN, Lyapunov SM, Marochkina EB, Okina OI, et al. Application of a standardized human biomonitoring methodology to assess prenatal exposure to mercury. Hygiene and Sanitation 5: 10-18.
- Ilchenko IN, Bylova NA, Frontasyeva MV, Lyapunov SM, Gorbunov AV, et al. (2010) The concentration of toxic, potentially toxic and essential elements in the blood of Moscow women and the risk of developing low body weight (pilot study). Preventive medicine. 1(7): 7-12.
- Berg T, Steinnes E (1997) Use of mosses (Hylocomium splendens and Pleurozium schreberi) as biomonitors of heavy metal deposition: from relative to absolute deposition values. Environmental Pollution 98(1): 61-71.
- Boyarskaya T, Ilchenko I, Lyapunov S, Okina O (2017) Exposure to mercury and weight-growth characteristics of the newborns in republic of Karelia, Russia. European Journal of Public Healh 27 № Suppl 3 28.
- State standards. Raw materials and food products. Publishing house of standards, 1998
- Groth E 3rd (2010) Ranking the contributions of commercial fish and shellfish varieties to mercury exposure in the United States: implications for risk communication. Environ Res 110: 226-36
- Noelle E, Selin, Elsie M Sunderland, Christopher D, Knightes, et al. (2010) Sources of Mercury Exposure for U.S. Seafood Consumers: Implications for Policy. Environ Health Perspect 118(1): 137-143.
- Procedures for the Handling and Processing of Blood Specimens Approved Guideline. Third Edition, 24(38).
- Gremyachikh VA, Kamshilova TB, Komov VT (2013) Accumulation of mercury in muscles and growth rate of perch (Perca fluvatilis Linnaeus) from the lakes of the Polistovo-Lovatsky raised bog massif. Water: chemistry and ecology. 12: 58-63.
- Komov VT, Stepanova IK, Gremyachikh VA (2004) The content of mercury in the muscles of fish from the water bodies of the North-West of Russia: the reasons for intensive accumulation and assessment of the negative effect on the state of human health. Actual problems of water toxicology. Borok. Institute of Biol. int. waters RAS 99-123.
- Nemova NN (2005) Biochemical effects of mercury accumulation in fish. M: Nauka 161.
- Sanpin 2.3.2.560-96 (1994) Hygienic requirements for the quality and safety of food raw materials and food products Kaim, Schwederski B. Bioinorganic Chemistry: Inorganic Elements in the Chemistry of Life. Chichester: John Wile and Sons 401.
- The Occurrence of Mercury in the Fishery Resources of the Gulf of Mexico.
- (1999) Toxicological Profile for Mercury. US Department of health and human services. Public Health Service Agency for Toxic Substances and Disease Registry pp. 611.
- US FDA (Food and Drug Administration) (1990-2010) National Marine Fisheries Service Survey of Trace Elements in the Fishery Resource.
-
AV Gorbunov, SM Lyapunov, MV Frontasyeva, SS Pavlov. Assessment of the Dependence of Mercury Intake into the Human Body on the Peculiarities of the Human Diet. Estimation of Intake of Small and Ultra-Low Doses of Mercury in the Human Body with Food. 4(5): 2020. ABEB.MS.ID.000597.
-
Mercury, Ultra-low doses, Food, Diets, Freshwater and marine fish, Accumulation features, Human body, Intake
-

This work is licensed under a Creative Commons Attribution-NonCommercial 4.0 International License.


