 Research Article
Application of (Bio)Chemical Engineering Concepts and Tools to Model GRC-s, and Some Essential CCM Pathways in Living Cells. Part 3. Applications in the Bioengineering Area
Gheorghe Maria1,2*
1Department of Chemical and Biochemical Engineering, Politehnica University of Bucharest, Polizu Str. 1-7, Bucharest 011061, Romania
2Romanian Academy, Chemical Sciences section, Calea Victoriei 125, Bucharest 010071, Romania
Gheorghe Maria, Dept. of Chemical and Biochemical Engineering, Politehnica University of Bucharest, Romanian Academy, Chemical Sciences section, Calea Victoriei 125, Bucharest 010071, Romania
Received Date: December 22, 2023; Published Date: May 01, 2024
Abstract
In the 1-st part of this work the general chemical and biochemical engineering (CBE) concepts and rules are briefly reviewed, together with the rules of the control theory of nonlinear systems (NSCT), all in the context of deriving deterministic modular structured cell kinetic models (MSDKM) and of hybrid structured modular dynamic (kinetic) models (HSMDM) (with continuous variables, based on cellular metabolic reaction mechanisms). In such HSMDM, the cell-scale model (including nano-level state variables) is linked to the biological reactor macro-scale state variables for improving the both model prediction quality and its validity range. By contrast, the current (classical/default) approach in biochemical engineering and bioengineering practice for solving design, optimization and control problems based on the math models of industrial biological reactors is to use unstructured Monod (for cell culture reactor) or Michaelis-Menten (if only enzymatic reactions are retained) global kinetic models by ignoring detailed representations of metabolic cellular processes.
The applied engineering rules to develop MSDKM and HSMDM dynamic math models presented in the 1-st and 2-nd parts of this paper are
similar to those used in the CBE, and in the NSCT. As exemplified in the 3&4 parts of this work, the MSDKM models can adequately represent the
dynamics of cell-scale CCM (central carbon metabolism) key-modules, and of Genetic Regulatory Circuits (GRC) / networks (GRN) that regulate
the CCM-syntheses. As reviewed in the 2-nd part of this paper, an accurate and realistic math modelling of individual GERM-s (gene expression
regulatory module) kinetic models, but also various genetic regulatory circuits (GRC) / networks (GRN). (e.g. toggle-switch, amplitude filters,
modified operons, etc.) can be done by only using the novel holistic ’whole-cell of variable-volume’ (WCVV) modelling framework introduced and
promoted by the author. Also, special attention was paid in the 2-nd part to the conceptual and numerical rules used to construct various individual
GERM-s kinetic models, but also various GRC-s / GRN-s modular kinetic models from linking individual GERM-s of desired regulatory properties,
quantitatively expressed by their performance indices (P.I.-s). As exemplified in the Parts 3 and 4 of this work, the use of MSDKM and of HSMDM
models (developed under the novel WCVV modelling framework) to simulate the dynamics of the bioreactor and, implicitly, the dynamics of the
cellular metabolic processes occurring in the bioreactor biomass, presents multiple advantages, such as:
a) A higher degree of accuracy and of the prediction detailing for the bioreactor dynamic parameters (at a macro- and nano-scale level) and,
b) The prediction of the biomass metabolism adaptation over tens of cell cycles to the variation of the operating conditions in the bioreactor;
c) Prediction of the CCM key-species dynamics, by also including the metabolites of interest for the industrial biosynthesis.;
d) Prediction of the CCM stationary reaction rates (i.e. Metabolic fluxes) allow to in-silico design gmo of desired characteristics.
As proved by Maria [1-5], and Yang, et al. [176], the modular structured kinetic models can reproduce the dynamics of complex metabolic syntheses
inside living cells. This is why, the modular GRC dynamic models, of an adequate mathematical representation, seem to be the most comprehensive
mean for a rational design of the regulatory GRC with desired behaviour [178]. Once experimentally validated, such extended structured cellular
kinetic models MSDKM including nano-scale state variables are further linked to those of the bioreactor dynamic models (including macro-scale
state variables), thus resulting HSMDM models that can satisfactorily simulate, on a deterministic basis, the self-regulation of cell metabolism
and its rapid adaptation over dozens of cell cycles to the changing bioreactor reaction environment, by means of complex GRC-s, which include
chains of individual GERM-s. In a HSMDM, the cell-scale model (including nano-level state variables) is linked to the biological reactor macro-scale
state variables for improving the both model prediction quality and its validity range. Due to such particulars, as exemplify here, the immediate
applications of such MSDKM and HSMDM kinetic models are related to solving various difficult bioengineering problems, such as:
a) In-silico off-line optimize the operating policy of various types of bioreactors, and
b) In-silico design/check some gmo-s of industrial use able to improve the performances of several bioprocess/bioreactors.
Note:
a) Part 1 (General concepts) of this paper will soon appear in Current Trends in Biomedical Eng & Biosci., (Juniper publ, Irvine CA, USA)
b) Part 2 (Mathematical modelling framework) of this paper will soon appear in Annals of Reviews & Research, (Juniper publ, Irvine CA, USA)
In the absence of these papers (parts 1& 2), the reader is asked to consult the references [4,5]. “c) Part 4. (Applications in the design of some genetically modified micro-organisms (GMOs)) of this paper will soon appear in Annals of Systems Biology (Peertechz publ, USA)”
Keywords:Biochemical engineering concepts applied in bioinformatics; Deterministic modular structured cell kinetic model (MSDKM); Hybrid structured modular dynamic (kinetic) models (HSMDM); Whole cell variable cell volume (WCVV) modelling framework; Whole cell constant cell volume (WCCV) modelling framework; Individual gene expression regulatory module (GERM); Genetic regulatory circuits (GRC), or networks (GRN); Chemical and biochemical engineering principles (CBE); Rules of the control theory of nonlinear systems (NSCT); Kinetic model of glycolysis in E. coli; Glycolytic oscillations; GRC of mercury-operon expression regulation in modified E. coli cells; Three-phase fluidized bioreactor (TPFB) for mercury uptake by cloned E. coli cells; Fed-batch bioreactor (FBR) for tryptophan (TRP) production using in-silico design E. coli GMO cells; Tryptophan production maximization in a FBR; Design GRC of a genetic switch (GS) type, with the role of a biosensor in GMO E. coli cells; Pareto optimal front to maximize both biomass and succinate production by using design GMO E. coli cells based on the in-silico tested gene knockout strategies; Optimal operating policies of a fed-batch bioreactor (FBR) used for monoclonal antibodies (mAbs) production maximization; Mercuryoperon expression regulation in modified E. coli cells; Cloned E. coli cells with mercury-plasmids; Gene knockout strategies to design optimized GMO E. coli for succinate production maximization; Pareto optimal front to maximize both biomass and succinate production in batch bioreactors (BR) using GMO E. coli cells
Introduction
In the last decades, there has been a tendency to replace the complex processes of fine chemical synthesis, highly energy-consuming and generating large amounts of toxic waste, with biosynthesis processes (using isolated and purified enzymes, or cell cultures as bio-catalysts). The motivation is given by the multiple advantages offered by enzymatic processes (Figure 1):
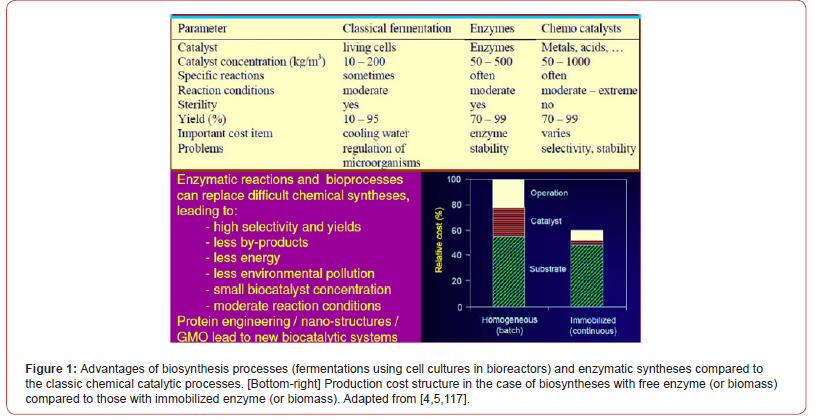
a) Very high selectivity;
b) Very high conversion;
c) Does not generate toxic by-products;
d) Very mild reaction conditions, easy to achieve without high
costs (low temperatures of 20-60°c, normal pressure, PH within
controllable limits).
Thus, in recent years, a significant number of enzymatic or biological
industrial processes have been reported [4-9] in order to
obtain chemical products/derivatives in the fine organic synthesis
industry, in the pharmaceutical industry, in the food industry or in
the detergent industry, by using various bioreactors with cell or enzyme
cultures [6,9]. Among these new processes are the production
of derivatives of monosaccharides, organic acids, alcohols, amino
acids, etc., using mono- or multi-enzymatic reactors, or bioreactors
with cell cultures used in the production of yeast, food additives,
recombinant proteins (enzymes, vaccines), biopolymers [6,7,10].
The development of a sustainable biological process must consider
several aspects related to the characteristics of the biocatalyst, the
integration of the process and the minimization of costs, satisfying
economic, environmental / safety and social objectives [11-13].
When the scale-up of a new biological process is aimed at, in a first
stage the characteristics of the biological process are determined
on an experimental basis (process kinetic model, optimal reaction
conditions, biomass deactivation kinetics). Next, several biochemical
engineering problems must be solved, consisting of:
a) Choosing the type of biological reactor (with cell cultures)
most suitable for the studied bioprocess (with perfect mixing
CSTR, or with total displacement if the biomass is immobilized
in a fixed layer, [7]);
b) Choosing the optimal mode of operation of the selected bioreactor
(discontinuous BR; semi-continuous (fed-batch) FBR
with a variable feeding of flow-rate, substrates/enzymes; discontinuous
with intermittent addition of biomass/substrate
BRP; or continuous stirred tank reactor CSTR, with a continuous
feeding and evacuation of the liquid-phase, mixed types,
etc. [7]);
c) Choosing how to use the biocatalyst (biomass in a free state
or immobilized on a suitable solid/gel support). Biomass immobilization
is desirable because it leads to an increase in its
stability and duration of activity, with favourable economic
effects, since the cost of the non-immobilized biocatalyst contributes
the most to the production cost, as can be seen from
(Figure 1) [14]. More details on the biocatalyst immobilization
can be found in the literature [15-17].
The importance of optimal operation of biological reactors. In the case of the biological reactors (with free, or immobilized biomass), the trend in the biosynthesis industry is to use complex systems, with more efficient genetically modified micro-organisms (GMO), and employing sophisticated but efficient immobilization systems, which prevent the premature inactivation of the biomass due to mechanical and chemical stress from the bioreactor environment. Thus, modern biological processes, together with the multi-enzymatic ones, prove to be very effective in the biosynthesis of numerous chemical compounds, thus competing in terms of efficiency with organic chemical synthesis, proceeding with high selectivity and specificity, by reducing consumption of energy and generating less environmental pollution (Figure 1). This characteristic of industrial biosynthesis is exploited for various economic purposes (industry, medicine, environment, agriculture, fuel production) [18,19].
However, industrial bioprocesses still have a limited spread due to the high costs of enzyme/biomass isolation and stabilization on a suitable support, as well as its high sensitivity in relation to the operating conditions, the rather low reproducibility of the biological process due to biomass changes from one cell cycle to another, and of the difficult controllability of the bioreactor. However, many of these drawbacks can be overcome by an efficient immobilization of the biomass on suitable supports, by using suitable GMO-s with superior catalytic activity, and/or by optimizing the working conditions and the operation mode for the selected biological reactor, by using an advanced off-line in-silico analysis of the engineering part of bioprocess development based on effective MSDKM and HSMDM kinetic math models and effective numerical algorithms.
As proved in the literature [1,2,4,5,20-23] , and shortly reviewed in the Part-1 of this work [4], the in-silico (math/kinetic model-based) numerical analysis of biochemical or biological processes are proved to be not only an essential but also an extremely beneficial tool for engineering evaluations aiming to determine the optimal operating policies of complex multi-enzymatic reactors [10,24-29], or bioreactors [4,5,7,20,30,31]. In the Part-1 of this work, the general chemical and biochemical engineering (CBE) concepts and rules are briefly reviewed, together with the rules of the control theory of nonlinear systems (NSCT), all in the context of deriving deterministic modular structured cell kinetic models (MSDKM) and of hybrid structured modular dynamic (kinetic) models (HSMDM) (with continuous variables, based on cellular metabolic reaction mechanisms) [4].
In the Part-2 of this work [4], a special attention is paid to the authors’ contributions related to dynamics simulation of the gene expression regulatory modules (GERM) and of genetic regulation circuits/networks (GRC/GRN) in living cells, by introducing and promoting the novel concepts of a novel cell modelling framework, that is the so-called “Whole cell variable cell volume” (WCVV) dynamic models. The advantages of using the WCVV models to simulate the cell metabolic processes has been proved when building-up dynamic models of modular structures that can reproduce complex metabolic CCM-based syntheses and GRC-s inside living cells. These advantages of the more realistic WCVV approach are briefly underlined and exemplified when developing kinetic representations of the gene expression regulatory modules (GERM) that control the protein synthesis and homeostasis of metabolic processes. Exemplifications are made in the Part-2 comparatively to classical (default, incorrect) “Whole cell constant cell volume” (WCCV) dynamic models, and in the Parts 3&4 of the work when design GMO-s and optimize bioreactor operation using effective MSDKM and HSMDM kinetic math models and effective numerical algorithms [4].
The topics approached in this paper belongs to the emergent field of Systems Biology, defined as “the science of discovering, modelling, understanding and ultimately engineering at the molecular level the dynamic relationships between the biological molecules that define living organisms” (Leroy Hood, Inst. Systems Biology, Seattle). Systems Biology is one of the modern tools, which uses advanced mathematical simulation models for in-silico re-design of GMO-s that possess specific and desired functions and characteristics. In fact, as discussed in the Part-1 of this work, this emergent research/applicative field is closely inter-connected with the socalled ’Computational systems biology’, or simply ’Bioinformatics’. as depicted in the (Figure 9) of Part-1 of this work [4,19]. In fact, all these relatively novel research/applicative fields are strongly related, and inspired from the CBE, NSCT principles and rules (see Figures 4-6, 8 of Part-1 of this work [4], and GERM/GRC modelling of Part-2[4]). These rules involve application of the classical CBE modelling techniques (mass balance, thermodynamic principles), algorithmic rules, and NSCT concepts and rules (Sections 2.3.5, and 2.3.6 of Part-2 [4]). The metabolic pathway representation with continuous and/or stochastic variables remains the most adequate and preferred representation of the cell processes, the adaptable- size and structure of the lumped model depending on available information and the utilisation scope.
The translation of the CBE and NSCT concepts/rules in Systems
Biology, Computational biology, and Bioinformatics is leading to obtain
extended structured cellular kinetic models MSDKM including
nano-scale state variables adequately representing the dynamics of
the key-reaction-modules of the cell CCM and GRN. If the MSDKM
model is further linked to those of the bioreactor dynamic model
(including macro-scale state variables), the result is the HSMDM
dynamic model that can satisfactorily simulate, on a deterministic
basis, the self-regulation of the cell central metabolism and its rapid
adaptation over dozens of cell cycles to the changing bioreactor
reaction environment, by means of complex GRC-s, which include
chains of individual GERM-s. In a HSMDM, the cell-scale model (including
nano-level state variables) is linked to the biological reactor
macro-scale state variables for improving the both model prediction
quality and its validity range. Due to such particulars, as exemplify
here, the immediate applications of such MSDKM and HSMDM
kinetic models are related to solving various difficult bioengineering
problems, such as:
a) In-silico off-line optimize the operating policy of various types
of bioreactors, and
b) In-silico design/check some GMO-s of industrial use able to
improve the performances of several bioprocess/bioreactors.
As exemplified in the 3&4 parts [4], the use of MSDKM and
of HSMDM models (developed under the novel WCVV modelling
framework) is able to simulate the dynamics of the bioreactor simultaneously
with the dynamics of the cellular metabolic processes
occurring in the bioreactor biomass. Such extended HSMDM
models present multiple advantages, such as:
a) A higher degree of accuracy and of the prediction detailing
for the bioreactor dynamic parameters (at a macro- and nano-
scale level);
b) The prediction of the biomass metabolism adaptation over
tens of cell cycles to the variation of the operating conditions
in the bioreactor;
c) Prediction of the CCM key-species dynamics, by also including
the metabolites of interest for the industrial biosynthesis.;
d) Prediction of the ccm stationary reaction rates (i.e. Metabolic
fluxes) allows to in-silico design GMO of desired characteristics.
This work is aiming to prove, by using a certain number of case
studies, solved and published by the author, the feasibility and advantage
of using the relatively novel HSMDM concept by coupling
extended CCM-, and GRC-based cell structured deterministic nano-
scale models with the macro-scale state-variables of the analyzed
bioreactor models. The resulted hybrid dynamic model was
successfully used for engineering evaluations. To exemplify the theoretical
concepts described in the Parts 1-2 of this work [4], and
the above mentioned advantages of HSMDM models, several case
studies of industrial interest, previously solved by the author, are
briefly reviewed in the Parts 3&4 of this work [4]. More case studies
have been presented in detail by [4,5,20,32]. Among them, it is to
mention the followings:
a) In-silico design of a genetic switch in E. coli with the role of a
biosensor [4,5,33-36];
b) An HSMDM math model able to simulate the dynamics of the
mercury-operon expression in E. coli cells, and its self-regulation
over dozens of cell cycles, simultaneously with the dynamics
of the macro-level state variables of a semi-continuous reactor
(SCR) of a three-phase fluidized bioreactor type (TPFB).
The same extended model was used to In-silico design of
cloned E. coli cells (with variable mer-plasmid concentrations)
aiming at maximize the biomass capacity of mercury uptake
from wastewaters [37-40].
c) An HSMDM math model able to simulate the dynamics of
key-species of the CCM of E. coli cell coupled with the simulation
of the macro-scale state variables of a batch reactor (BR).
The HSMDM model was used to in-silico design of a GMO E.
coli with a maximized capacity of both biomass and succinate
(SUCC) production. The used numerical techniques were those
of the gene knock-out, and of the Pareto-front for multi-objective
problems [41].
d) The use of an HSMDM math model to in-silico design of a GMO
E. coli with a modified glycolytic oscillator [42-59]. Complex
MSDKM structured models including CCM and GRC modules
are able to predict conditions for oscillations occurrence for
various cell processes [43,44,46-50,52,176]. As studied by
Yang et al. [176], “all biochemical reactions in organisms cannot
occur simultaneously due to constraints of thermodynamic
feasibility and resource availability, just as all trains in a country
cannot run simultaneously. Therefore, oscillations provide
overall planning and coordination for the inner workings of
the cellular system. This seems to be contrary to the theoreti
cal basis of GEMs (genome-scale metabolic models), which are
based on the steady-state hypothesis and flux balance analysis
[177], but just as computers will not operate in the same
way as the human brain, this difference can be understood and
accepted, so that non-equilibrium theory and the steady-state
hypothesis have been and will continue to coexist and guide
our reasoning [176].”
e) The use of an extended HSMDM math model to simulate the
dynamics of the nano-scale CCM key-species, and of the tryptophan
(TRP)-operon expression, and its self-regulation, together
with the dynamics of the macro-scale state-variables of a FBR
including genetically modified E. coli cultures. Eventually, this
dynamic model was used to design/check a GMO E. coli, and to
determine the multi-control optimal operating policy of a bioreactor
(FBR) to maximize the tryptophan (TRP) production
[4,5,30,44,45,60-66].
f) An MSDKM math model able to simulate the dynamics of
key-species of the CCM of E. coli cell involved in the synthesis of
Phenyl-alanine (PHA). The HSMDM model was used to in-silico
re-configure the metabolic pathway for Phenyl-alanine synthesis
in E. coli [32] to maximize its production. That implies to
modify the structure and activity of the involved enzymes, and
modification of the existing regulatory loops. Searching variables
of the formulated mixed-integer nonlinear programming
(MINLP) multi-objective optimization problem are the followings:
the regulatory loops (that is integer variables, taking “0”
value when the loop has to be deleted, or the value “1” when it
has to be retained); the enzyme expression levels (that is continuous
variables), and all these in the presence of the stoichiometric
and thermodynamic constraints. To solve this complex
optimization problem, two contrary objectives are formulated:
maximization of the PHA selectivity, with minimization of cell
metabolites’ concentration deviations from their homeostatic
levels (to avoid an unbalanced cell growth). The elegant solution
of the problem is the so-called Pareto-optimal front, which
is the locus of the best trade-off between the two adverse objectives.
By choosing two problem solution alternatives from
this Pareto-curve [32,4,5], it is to observe the large differences
between the two pathways into the cell, fully achievable by
using the genetic engineering techniques to produce desirable
GMO-s.
g) A HSMDM model to simulate the dynamics of the key-species
and of the FBR state-variables used for monoclonal antibodies
(mAbs) production. This extended dynamic model was used for
the in-silico off-line derivation of the multi-objective optimal
control policies to maximize the mAbs production in an industrial
FBR [7].
Some of these case studies are discussed in the Parts 3 and 4 of this work [4]. For the others, the reader is asked to consult the above indicated references.
MCase study no. 1. In-Silico Modulate Operating Conditions Leading to Glycolytic Oscillations and Their Interference with the TRP Synthesis in E. coli Cells
Abbreviations and notations used in this section 2

Cellular oscillations – an overview
This section is aiming at presenting a lumped structured MSDKM dynamic math model used to simulate wild or GMO E. coli having the glycolytic oscillations as key-node to induce oscillations in the whole CCM. As an example, the influence of glycolytic oscillations on the synthesis of excretable tryptophan (TRP) is discussed as a direct application of industrial interest. The same MSDKM math model can be used to in-silico design of a GMO E. coli with a modified glycolytic oscillator of practical interest [42-59]. As presented in this case study, and in the next case study, the here elaborated HSMDM model can be further used “for in-silico design of a GMO E. coli with a modified glycolytic oscillator [42,44-46,68]. The HSMDM model can be further used as the core of a modular dynamic model used to simulate the CCM and regulation of various metabolite systheses, with application to in silico reprogramming of the cell metabolism to design GMO of various applications [4,20]. One example is the In-silico off-line optimization of the operating conditions of a fed-batch bioreactor (FBR) with design GMO E. coli to maximize the production of tryptophan (TRP) [30,60]. Thus, compared to a simple batch bioreactor (BR) using a wild E. coli cell culture, the TRP production was increased with 73% (50% due to the novel GMO E. coli strain, and 23% due to the model-based optimization of the variable feeding of the FBR). [30,44-46,60,66,68].
Generally, autonomous oscillations of species levels in the glycolysis express the self-control of this essential cellular pathway belonging to the cell CCM, and this phenomenon takes place in a large number of bacteria. Oscillations of glycolytic intermediates in living cells occur according to the environmental conditions, and to the cell characteristics, especially the Adenosin-triphosphate (ATP)-recovery system. Determining the conditions that lead to the occurrence and maintenance of the glycolytic oscillations can present immediate practical applications. Such a model-based analysis allows in silico (model-based) design of genetic modified micro-organisms (GMO) with certain characteristics of interest for the biosynthesis industry, medicine, etc. Based on our kinetic model validated in previous works, this paper is aiming to in silico identify operating parameters and cell factors leading to the occurrence of stable glycolytic oscillations in the E. coli cells. As long as most of the glycolytic intermediates are involved in various cellular metabolic pathways belonging to the CCM, evaluation of the dynamics and average level of its intermediates is of high importance for further applicative analyses. As an example, by using a lumped kinetic model for tryptophan (TRP) synthesis from literature, this section highlights the influence of glycolytic oscillations on the oscillatory TRP synthesis through the PEP (phosphoenolpyruvate) glycolytic node. The analysis allows further TRP production maximization in a Fed-batch bioreactor (FBR).
Cellular oscillations – an overview
Autonomous oscillations of species levels in the glycolysis express the self-control of this essential cellular pathway belonging to the CCM, and this phenomenon takes place in a large number of bacteria. “The study of glycolytic oscillations might, therefore, prove crucial for the general understanding of the cell metabolism regulation and the connections among different components of the metabolism. The key question in this context is the mechanism of the oscillations but, despite much work over the last 40 years, it remains unsettled” [69,70].
A model able to simulate the dynamics of the cell CCM must include
linked modules relating to
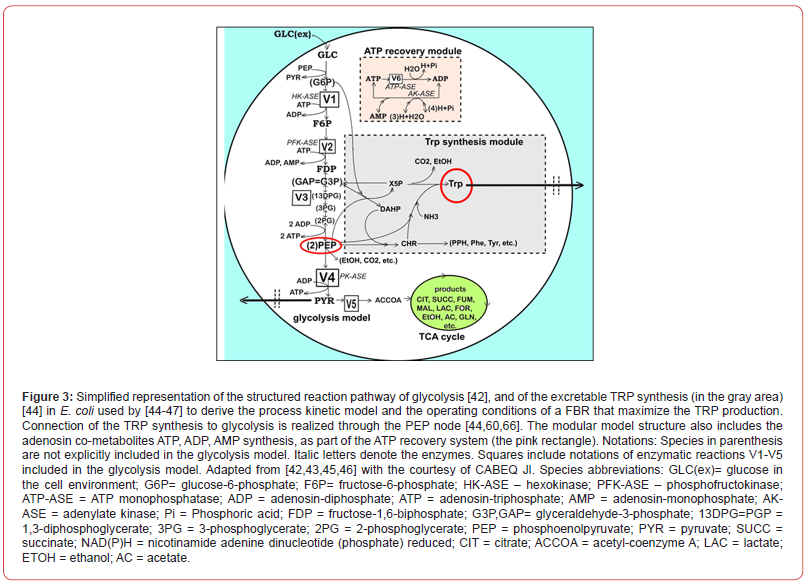
a) The glycolysis (Figures 2 &3);
b) The phosphotransferase (PTS)-system for GLC import into the
cell (Figure 2);
c) The pentose-phosphate pathway (PPP) to generate NADPH
and pentoses (5-carbonsugars), as well as ribose 5-phosphate
(R5P, a precursor for the synthesis of nucleotides);
d) The tricarboxylic acid cycle (TCA);
e) The ATP-recovery system, and several other pathways [4,71-
74].
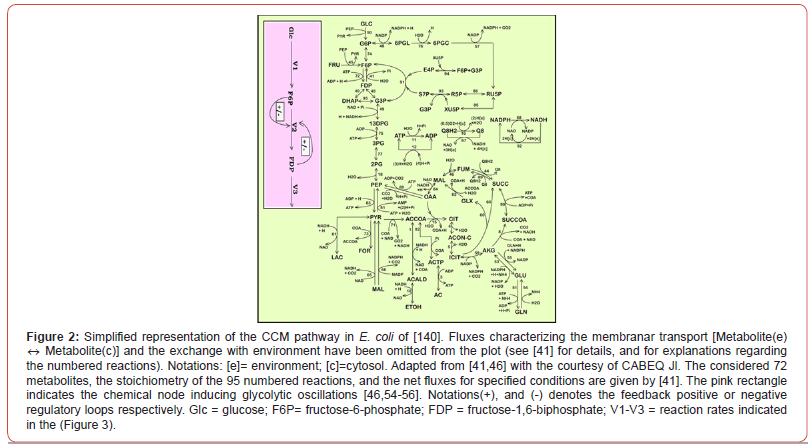
Modelling bacteria CCM, or parts of CCM, is a subject of very high interest, because the CCM is the essential part of any systematic and structured (model-based) in-silico analysis of the cell metabolism with immediate applications, such as: biosynthesis optimization, metabolic fluxes evaluation [75], model-based design of GMO with target characteristics of various applications in the industry, medicine, etc. [4,5,18,19,32,37-39,44-46,68,76-78]. To cope with the very high complexity of cell metabolic processes, involving ca. 104 species concentrations, 103 gene expression transcription factors, and ca. 105 enzymatic reactions, adaptable reduced dynamic models, of ‘building-blocks’ like modular construction, have been developed over the last decades (see the reviews of [1,2,4,5]), with including individual/lumped species and/or reactions. Modelling the glycolysis dynamics is of particular interest, because most of its intermediates are starting points for the internal production of various metabolites of industrial/medical use (e.g. amino-acids, succinate, citrate, etc; [4,5,30,60,71,72]).
By using two adequate dynamic models validated by the author
in previous studies (Tables 2&3), this paper exemplifies how the
model-based analysis can be used
a) to predict some of the internal/environmental conditions inducing
glycolytic oscillations in the E. coli culture grown in a
fed-batch bioreactor (FBR), and
b) to simulate the influence of the glycolytic oscillations on the
TRP oscillatory synthesis by means of the common key-species
PEP. Industrial applications are immediate seeking for TRP
production optimization. The glycolytic oscillations occurrence
will be analysed vs. external ([GLC] in the bulk-phase),
and internal factors (that is the ATP recovery rate, dependent
on the cell phenotype) [42,44,46,79].
The tested FBR
The in-silico study of the glycolytic oscillations, connected to the TRP synthesis dynamics, is performed by considering a FBR with a suspended E. coli cell culture, operated with the initial/nominal conditions given in (Table 1). It is worth mentioning that the bioreactor includes an excess of sparged air, and necessary nutrients for a balanced growth of the cell culture. This FBR was used by Chassagnole et al. [67] to develop experimental kinetic studies to validate their CCM model (denoted here by CHASSM). The same experiments have also been used by Maria [42] to validate his reduced kinetic model of glycolysis (denoted here by MGM). The adopted SBR (Table 2-A, with a constant dillution “D”), or FBR model (Table 2B, with a time step-wise variable feeding policy, over j = 1,…, Ndiv equal time-arcs, and for Ndiv =5 ) is a classical one [80], developed with the following main hypotheses [43,45,46,68]:
Table 1: The nominal initial operating conditions of the FBR used by Chen [62] to collect the kinetic data of the TRP synthesis by using a suspended culture of a wild, or of a genetically modified E. coli cells (T5 strain). This semi-continuous bioreactor (SBR/FBR) with suspended E. coli cell culture used to simulate the glycolytic and TRP synthesis processes [44,60], and to optimize the FBR operating policy [30].
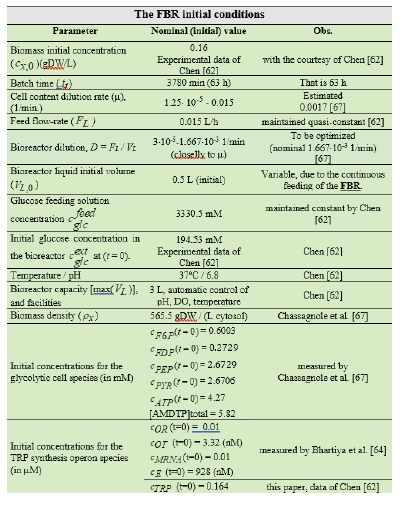
a) The operation is isothermal, iso-ph, and iso-DO (dissolved oxygen);
b) Nutrients are added to the FBR, in recommended quantities,
together with an aeration in excess (with air, or pure oxygen)
for ensuring an optimal biomass maintenance;
c) A perfectly mixed liquid phase (with no concentration gradients).
The mass balance equations account for the main species in the FBR -bulk and of the cellular ones referring to the glycolysis and TRP synthesis dynamics. To obtain the species time-trajectories with a satisfactory accuracy, a low-order stiff integrator (“ODE23S”) of the Matlab™ software was used.
Dynamic models for the oscillating glycolysis coupled with the TRP oscillating synthesis in the E. coli cells ”Glycolysis model
Glycolysis is a sequence of enzymatic reactions (Figures 2-3) that converts glucose (GLC) into pyruvate (PYR). “The free energy released by the subsequent TCA originating from PYR is used to form the high-energy molecules ATP, and NADH that support the glycolysis and the other enzymatic reactions into the cell” [79]. Consequently, an adequate modelling/simulation of the glycolysis kinetics is of high importance because its intermediates are entry/ exit points to/from glycolysis. “For instance, most of the monosaccharides, such as fructose or galactose, can be converted to one of the glycolytic intermediates. In turn, glycolytic intermediates are directly used in subsequent metabolic pathways. For example, DHAP (an intermediate in the F6P conversion to G3P in Figure 2) is a source of the glycerol that combines with fatty acids to form fat. In addition, NADPH is also formed by the PPP, which converts GLC into R5P, which is used in the synthesis of nucleotides and nucleic acids.” PEP is, as well, the starting point for the synthesis of essential Aminoacids (AA) such as TRP, cysteine, arginine, serine, etc. [44,81]. Due to the huge importance of the glycolysis in simulating the CCM dynamics, intense efforts have been invested both in the experimental study, and in modeling of its dynamics in various bacteria [82-85].
However, modelling in detail the glycolysis kinetics and its regulation is a difficult task due to its high complexity. Despite these dilemmas, a large number of extended/lumped kinetic models have been proposed in the literature (review of Maria [42]), some of them being mentioned in (Outline 1), of a complexity varying in the range of 18-30 key species, 48-52 key reactions, with a total of 24-300 or more rate constants. Most of these models are however too complex to be easy to use and to estimate the rate constants. Besides, their adequacy is not always satisfactory. Thus, with few exceptions, most of the mentioned models cannot satisfactorily simulate the glycolytic oscillations on a deterministic basis. Starting from the reaction pathway of (Figure 2), from the CHASSM and other kinetic models (Outline 1; [41]), and by applying certain lumping algorithms [86-88], a reduced kinetic model of glycolysis (MGM) has been proposed by Maria [42]. MGM is accounting for 9 key species, 7 lumped reactions, and includes 17 rate constants (Table 2-A). Its parameters have been identified “by using the experimental kinetic data of [67,76].” The MGM model proved that it can satisfactorily simulate the dynamics of the glycolytic species concentrations (steady state QSS, oscillatory, or transient) according to various internal/external regimes, related to:
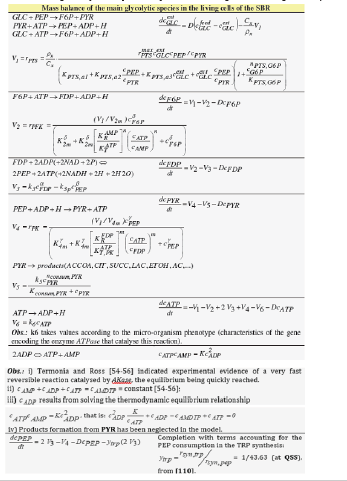
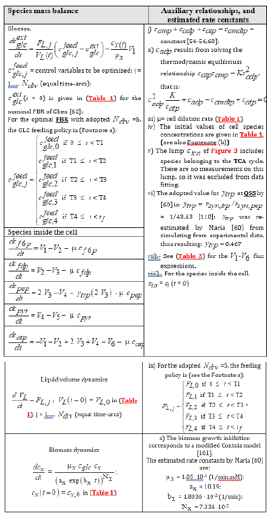
Table 2-A:Species mass balance in the SBR model, with a constant dillution “D”, describing the dynamics of the cellular glycolysis species according to the MGM kinetic model of Maria [42]. The glycolysis kinetic model also includes the modification of Maria et al. [44,60] when coupling with the TRP synthesis model. The model parameters are given by Maria [42,44,60]. Notations are given in the Figure 2 caption.
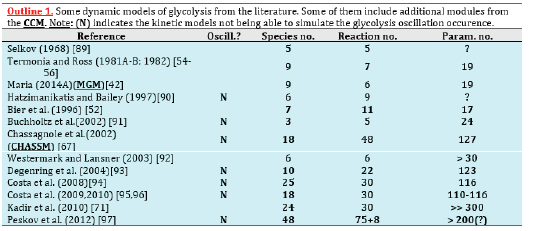
Table 2-B:Species mass balance in the SBR model, with a constant dillution “D”, describing the dynamics of the cellular glycolysis species according to the MGM kinetic model of Maria [42]. The glycolysis kinetic model also includes the modification of Maria et al. [44,60] when coupling with the TRP synthesis model. The model parameters are given by Maria [42,44,60]. Notations are given in the Figure 2 caption.
a) The GLC concentration level/dynamics in the bioreactor
b) The cell total energy resources in A(MDT)P, and
c) The cell phenotype responsible for activity of the enzymes involved
in the ATP utilization/recovery system.
The MGM has been inserted in the SBR (Table 2-A, with a constant dillution “D”), or in the FBR bioreactor model template (Table 2B. with a time step-wise variable feeding policy, over j = 1,…, Ndiv equal time-arcs, and for Ndiv =5 ) when simulating the dynamics of the [GLC] in the liquid-phase simultaneously with that of the cell metabolites. A direct connection between the macro-scale (bioreactor bulk-phase) and the nano-scale (cellular) process variables is thus realized. According to Franck [59], “oscillations in chemical systems represent periodic transitions in time of species concentrations”. Thus, “spontaneous occurrence of self-sustained oscillations in chemical systems is due the coupled actions of at least two simultaneous processes. Oscillations sourced in a so-called oscillation node (that is a chemical species, or a reaction), on which concomitant rapid positive (perturbing) and slow negative (recovering) regulatory loops act. Because the coupling action between the simultaneous processes is mutual, the total coupling effect actually forms closed feedback loops for each kinetic variable involved”. “There exists a well-established set of essential thermodynamic and kinetics pre-requisites for the occurrence of spontaneous oscillations”, as well as their consequences, extensively discussed by [42-46,59].
Table 2-C:Extended HSMDM model including the mass balance of the cell glycolytic key-species, and of the FBR control variables (inlet [GLC], inlet
feed flow-rate FL, and viable biomass X) for an optimally operated FBR (with time step-wise feeding policy, over j = 1,…, Ndiv equal time-arcs, and for
Ndiv =5). Adapted from [30,43-47,60]. Reaction rate expressions V1-V6 of the cell model, describing the dynamics of the cellular glycolytic species,
are those of the kinetic model of (Table 2-A) Maria [42,60], and of Chassagnole et al. [67]. See the notations of [30].
Footnote: (a) For the adopted Ndiv = 5, the j =1,…, Ndiv time-arcs approx. switching points are: T1= 12.5 h.; T2= 25 h.; T3= 37.5 h.; T4= 50 h.; = 63
hrs. The - time step-wise feed flow-rates are to be determined together with the other control variables (that is cfeedglc,j) to ensure the FBR optimal operation with maximizing the TRP production.
(b) The initial concentrations of cell species (F6P, FDP, PEP, PYR, ATP), and of the biomass are given in (Table 1).
“In the glycolysis case (Figures 2&3), oscillations are due to the
antagonistic action of two processes on regulating the V2 reaction
rate (i.e. the oscillation node).” [54-56,68]. The V2 lumped reaction
converts F6P in FDP (see the pink rectangle in Figure 2). Glycolytic
oscillations properties (period, amplitude) are determined by the
both external and internal (phenotype) factors. “According to Maria
et al. [42-59] the glycolysis dynamics (quasi steady-state QSS, transient,
or oscillatory) depends on several factors. Among them, are
to be mentioned the followings:
a) The glucose level in the liquid-phase {[GLC]ex}, which is determined
by the SBR/FBR operation conditions;
b) The efficiency and the dynamics of the whole ATP recovery
system. Among the involved parameters, an essential one is the
k6 rate constant (related to the ATP-ase characteristics in Figure
4). The involved enzymes characteristics are determined
by the cell phenotype (genom) controlling the total energy resources.
To not complicate our simulations, the [AMDTP] level
was kept unchanged in the present analysis at the value given
in (Figure 4), and in (Table 1).
c) As an important remark, “the glycolysis is a systemic process,
with a complex regulatory structure. Consequently, oscillations
are also related to the rate constants of the all involved
reactions, and their appropriate ratios (depending on the enzymes’
activity of each micro-organism)” [43,44,46,66].
TRP synthesis (TRP-operon expression) model
“TRP is an aromatic non-polar α-amino-acid essential in humans, that is used in the cell biosynthesis of proteins, being also a precursor to the neuro-transmitter serotonin, of the melatonin hormone, and of vitamin PP [98]”. Therefore, maximizing its production via off-line in-silico (model-based) analyses is of particular industrial interest. “The TRP operon expression in E. coli is one of the most extensively studied molecular regulatory systems” [99]. The synthesis of excretable TRP is known as being an oscillatory process. However, due to the process high complexity, only reduced dynamic models involving lumped reactions/species are used, the regulatory performance being included in adjustable model terms and rate constants. In the present analysis, the in-silico analysis of the TRP synthesis was performed by using the lumped kinetic model of Maria et al [44,45,60]. This kinetic model is based on the simplified TRP synthesis scheme displayed in (Figure 3), derived from various studies reviewed by Maria et al. [44,45,60]. The adopted model for the TRP synthesis, presented in (Table 3), is a modification of the [64] model in order to better fit the experimental kinetic curves of the cell key species {OR, mRNA, T, E} [44], but also of the state-variables of a FBR [60,62] (Table 2B). Beside, the model was explicitly connected to the glycolysis (as displayed in Figure 3), by including in the TRP mass-balance ((dctrp/dt) in Table 3) a term accounting for the PEP precursor, while the PEP consumption term is included in the PEP balance of the MGM model (Table 2B). Other dynamic models for the TRP synthesis module are reviewed by Maria et al. [44].
Glycolytic oscillations
Repeated simulations of the bioreactor dynamics with using
the SBR/MGM model, with the initial conditions of (Table 1) and
over the ranges of [GLC]ex Є [0.01-1.5] mM (at t=0), and k6 Є [10-5-
20] 1/min lead to the following conclusions [44-47]:
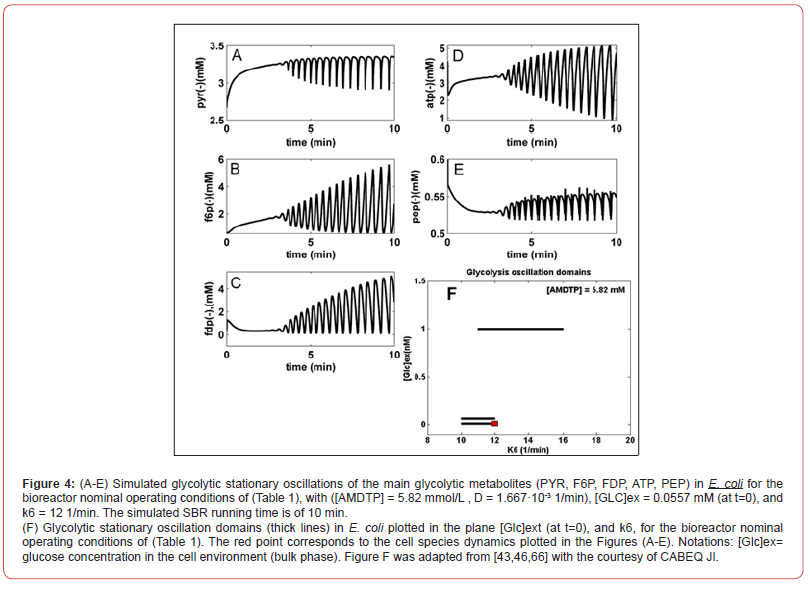
a) Several glycolytic stationary oscillations domains exist in the E.
coli cells, as indicated by the thick lines of (Figure 4-F) plotted
in the {[GLC]ex-vs.- k6} plane.
b) As resulted from (Figure 4-F), glycolytic stationary oscillations
occur for a slow GLC import due to a low [GLC]ex level in the
environment, but also due to small k6 constant values (that
corresponds to a low recovery rate of the ATP). Conversely,
higher concentrations of GLC in the bioreactor will trigger
higher GLC import rates. In this case, glycolytic oscillations are
also possible if the k6 constant reported large values (for a certain
K constant controlling the AMDTP pathway/equilibrium
given in Table 2-A). However, the ATP recovery rate is limited
by the AMDTP resources, and by the inter-conversion balance
of the AMDTP system (Figures 2&3, Table 2-A). As reported by
[44-47], in the cells with too small, or too large k6 values, the
glycolysis often reaches its (non-oscillatory) steady-state.
c) The glycolytic oscillation domains plotted in (Figure 4-F) are
very narrow. Such a result reflects their high sensitivity vs. lot
of external and internal factors. Besides, oscillations present
a poor stability vs. internal/external factors, as proved by the
plotted limit cycles (omitted here; see [43-47,66]). Experiments
in the literature have found that this stability is dependent
on the metabolism characteristics of every micro-organism.
For instance, by contrast, “the glycolytic oscillations in
yeast have been proved to be very robust even in the presence
of environmental noise, … oscillations being a side-effect of
the trade-offs between robustness and regulatory efficiency of
the … feedback control of the autocatalytic reaction network”
[100,101].
d) The simulation results indicated that larger values of k6 lead to
a slight decrease in the oscillation period and, eventually, the
oscillations disappearance. This is due to the quick consumption
of GLC by the cells following a more rapid ATP-recovery
system [43,66].
e) SBR dynamic simulations have identified glycolytic oscillations
with a period of 0.4-1 min, depending on the k6-value, and on
the [Glc]ex level [43-47]. For comparison, various experiments
in the literature have reported periods in a large range, that is:
“0.2 min. [69]; 2-100s [92]; 15s [53]; 1-20 min. [52], up to 3 h
[102], or 0.2min to hours [103].”
f) The simulated glycolytic oscillations of (Figure 4-B-C), (that
is FDP and F6P species) are similar to the experimentally recorded
dynamics by [104,105], and also similar to the dynamic
simulations of [89,52,106,107]. Figure 4(A-E) display an incipient
phase of the oscillation occurrence, when the species
oscillation amplitude grows. However, over a longer time domain
(not shown here), the oscillations stabilize and become
stationary.
g) The simulated [GLC]ex dynamics in the SBR proved that, for a
relatively high [GLC] = 200 mM in the feed, and for all the above
mentioned ranges of internal/external operating conditions,
the bioreactor evolution is always toward a steady-state (QSS),
with a faster or slower rate depending on the initial [GLC] in
the bioreactor, irrespectively to the cell metabolism (stationary/
homeostatic, or unbalanced) [43-47].
h) The factors influencing the glycolysis dynamics mentioned at
the end of chap. 2.5.1 are confirmed to have a major influence
on the glycolysis dynamics as proved by the present analysis.
TRP synthesis oscillations and their interference with the glycolytic oscillations
Under certain conditions, the TRP synthesis presents oscillations
[64]. Being strongly connected with the glycolysis (via PEP),
it is important to study the influence of the glycolytic oscillations
on the TRP synthesis dynamics. Such an analysis turns out to be of
high practical interest in order to adapt the bioreactor operation
to maximize the TRP production and, eventually, for the in-silico
design of GMO–s with such an objective (by modifying the cell metabolic
fluxes). In particular, the glycolysis intermediate PEP is the
starting point for the synthesis of essential amino-acids, including
TRP [81,108,109,110]. Having PEP as one of the precursors, maximization
of TRP synthesis clearly depends on the glycolysis intensity
(average levels of glycolytic species) and dynamics (QSS or oscillatory).
On the other hand, as previously discussed, glycolysis is
controlled by cell internal and external factors, which indirectly will
also influence the TRP synthesis, as follows:
a) The GLC import rate through the PTS-system (flux 50 in Figure
2) regulated and triggered by the environmental [GLC]ex, and
by the PEP and PYR levels into the cell (see V1 flux expression
in Table 2-A);
b) The limited ATP energy resources, and an ineffective/slow recovery
system can slowed down the GLC import, the glycolysis
and, implicitly, the all metabolic syntheses;
c) The bacteria genome (cell phenotype) plays an essential role,
because it determines the characteristics of the ATP-ase and
AK-ase enzymes (Figure 3) responsible for the ATP to ADP
conversion and for the ATP recovery rate during the glycolytic
reactions (modelled by means of the K and k6 rate constants in
the MGM kinetic model of Table 2-A). In fact, the efficiency of
the A(MDT)P inter-conversion system affects most of the metabolic
reactions.
d) Being a systemic process, inherently the glycolysis dynamics
(oscillations) are also related to the rate constants of all the
glycolytic reactions. As an example, Silva and Yunes [53] found
that oscillations are only possible if the [GLC]ex, and the maximum
reaction rates controlled by the PFKase and GKase are
within specific intervals. The GKase is one of the enzymes controlling
the V1 lumped reaction related to the PTS import system
(GLC to G6P and then to F6P in Figure 3 and Table 2A). The
PFKase controls the V2 reaction (of Figure 3, and Table 2A)
responsible for the FDP synthesis.
e) Following the results presented in the chap.2.5.3 (“Glycolytic
oscillations”), it is expected that, beside external parameters
(like [GLC]ex), also internal (like k6) to also influence the
TRP synthesis dynamics and performance. As has been proven
experimentally by Bhartiya et al. [64], the TRP synthesis is
an oscillatory process with a complex engine. In-silico (model-
based) analyses of Maria et al. [30,43-47,60] highlighted
some of the factors on which the dynamics and performance of
the TRP synthesis depends.
As mentioned by [99,111], “oscillations in the TRP synthesis are produced due to the concomitant activation and high order repression of the TRP-operon expression, together with a nonlinear demand for the end product, making its expresses to be cyclic.” Maria et al. [30,43-47,60] pointed-out through model-based simulations that the cell dilution rate (related to the cell cycle), adjusted to be quasi-even with the liquid residence-time in the bioreactor, also exerts a strong influence on the TRP system dynamics. Simulations of the present paper have been performed by using the SBR reactor model which includes the coupled glycolysis MGM model (Table 2-A), and the TRP synthesis kinetic model (Table 3). The sensitivity analysis of the TRP production was performed by considering some of the most influential parameters checked in the range of [GLC]ex [0.01-1.5] mM (at t=0), and k6 [10-5-20] 1/min, and D [10- 4 – 0.01] 1/min, with initial [GLC]ex [0.005-5] mM (at t=0). The simulation results for only two relevant operating conditions have been plotted in (Figures 4-A-B). This analysis lead to several results as follows: [30,43-47,60]
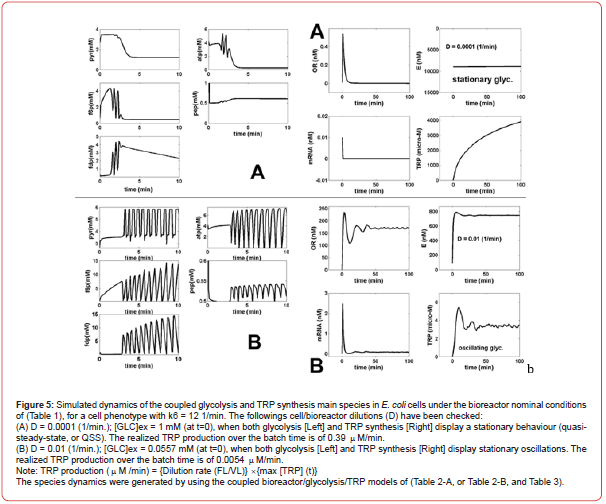
a) The [GLC]ex, the constant k6, and the bioreactor dilution D
(adjusted to be equal to the cell dilution) exert the highest
influence not only on the glycolysis dynamics, but also on the
TRP synthesis dynamics and production (due to its close link
to glycolysis through the common sharing node PEP). Thus,
under the initial SBR conditions of (Table 1), for a low SBR dilution
rate (D), and for conditions leading to a QSS glycolysis,
the TRP synthesis also displays a stationary evolution (Figure
5A). By contrast, at higher dilutions, and when glycolysis meets
the conditions necessary for an oscillatory process (of Figure
4F), the TRP synthesis also presents an oscillatory dynamic
(Figure 5B). Consequently, the bioreactor dilution presents a
strong influence on the QSS or oscillatory regime of the linked
glycolysis and TRP synthesis. The TRP production (see its definition
in the caption from Figure 5) is influenced accordingly.
A value of k6 = 12 min-1 was considered in all the tested
cases here. An exhaustive, or an adaptive model-based search
can identify the SBR operating conditions that correspond to a
maximum of TRP production [30,43-47,60].
b) While glycolysis exerts a strong influence on the TRP synthesis
dynamics, as proved by (Figures 5A-B), the reverse influence is
minor, as proved by disconnected glycolysis simulations (not
reproduced here).
c) The high feeding rates (D), or the high [GLC] in the feeding
solution of the SBR (Table 1), or high initial [GLC] in the bioreactor,
do not quantitatively influence the TRP bioreactor performances.
[30,43-47,60].
d) Simulations of the only TRP synthesis, disconnected from the
glycolytic process, but with employing various [PEP] average
levels [66], indicate that PEP average level has a huge influence
on the dynamics and concentrations of the TRP synthesis
species.
e) It clearly appears that, beside cell phenotype (defining for the
TRP operon expression), glycolysis is one of the major factors
influencing the TRP production. Thus, by ranging the SBR operating
parameters, the TRP production can be maximized
[30,43-47,60], as proved in the next chap. 3.
f) In all the SBR operating cases checked by Maria et al. [30,43-
47,60] with the initial conditions of (Table 1), but in the range
of D [10-4 – 0.01] 1/min, simulations demonstrated that the
[GLC]ex in the liquid always evolves toward its steady-state
(QSS) irrespectively of the stationary or oscillatory dynamics
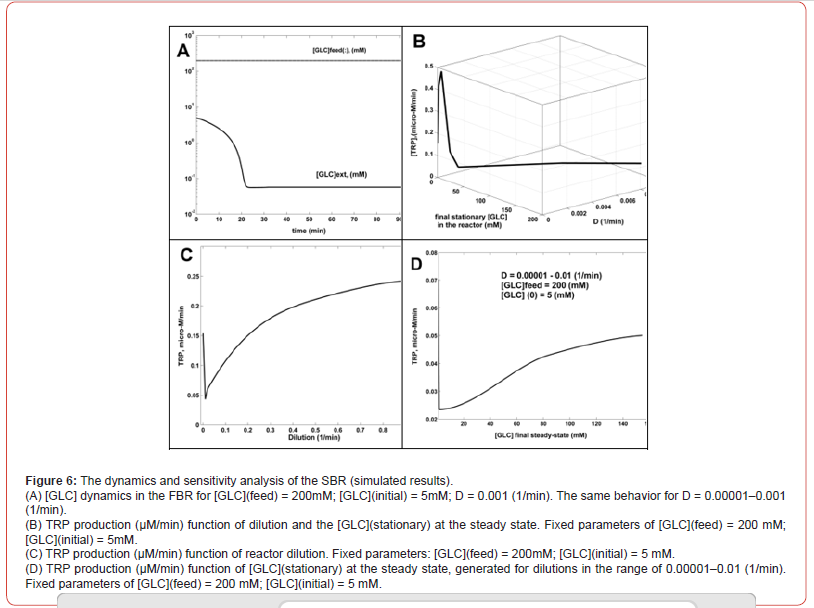
of the cell metabolic processes (Figure 6).
As remarked by Silva and Yunes [53], glycolytic oscillations “are focused on the maintenance of energy levels in the cell (negative regulation of PFKase by ATP) and thus the ability to limit the conversion into energy in situations where it is not needed. Therefore, it would be more advantageous to store it or deviate the flux towards other cell cycle activities such as cell division. Consequently, mutant cells with modified enzymes activity (especially PFKase, PKase, ATPase, AKase of Figure 3) will lead to a noticeable modification in the metabolism, and TRP synthesis”.
Engineering Implications-Sensitivity Analysis
Eventually, this in-silico analysis of the SBR by using the above
described HSMDM dynamic model suggests how to modulate these
most influential control variables and factors {[GLC]ex, via [GLC]
(feed), and [GLC](initial) D, k6 (via cell phenotype), and others} to
obtain an optimal operating policy of the SBR or of the FBR [e.g.
time step-wise variable feeding policy, in both feed flow-rate, and
[GLC](inlet), see the below chap 3] leading to maximization of the
TRP synthesis. An exhaustive or an adaptive model-based search
can identify the SBR optimal operating policy that corresponds to
a maximum of TRP production [30,43-47,60]. In the present study,
a quick sensitivity analysis based on the present model, revealed
several interesting conclusions, as followings: [30,43-47,60].
a) A larger number of SBR simulations with using various operating
parameters proved that SBR efficiency (TRP production)
is not influenced by [GLC](initial) < 100 mM in the bioreactor,
once [GLC](feed) > 100 mM.
b) In all tested cases covering the ranges [GLC](feed) of 100-200
mM, [GLC](initial) of 1-50 mM, D=0.00001–0.01 (1/min.),
the SBR evolves rapidly to its steady state, corresponding to
a small [GLC](stationary) < 1 mM (an example is displayed in
(Figure 6-A).
c) The TRP productivity increases with D, as plotted in (Figure
6-C).
d) The TRP productivity also increases with the [GLC]ex, as
plotted in (Figure 6-D), where external (bulk) concentration
is given by the steady-state level of the stationary [GLC]. The
combined dependency of TRP productivity on reactor dilution
and [GLC](stationary) is given in (Figure 6-B), confirming the
above conclusions (c-d), for a wide range of the reactor dilutions.
As proved in this work, the TRP productivity is also strongly dependent on the oscillatory characteristics of the glycolysis, determined by the above-mentioned operating parameters, and on the activity of enzymes involved in the ATP recovery system (that is the rate constants k6, K, and [AMDTP] of Table 2A). Thus, from the biological point of view, as mentioned by [53], “glycolytic oscillations are focused on the maintenance of energy levels in the cell (negative regulation of PFKase by ATP) and thus the ability to limit the conversion into energy in situations where it is not needed. Therefore, it would be more advantageous to store it or deviate the flux towards other cell cycle activities such as cell division. Consequently, GMO with modified enzymes activity (especially those related to the ATP use/recovery system of Figure 3) will lead to noticeable modifications in the metabolic species dynamics and concentrations.”
Conclusions
The in-silico analysis of this paper demonstrates “in a meaningful and relevant way the importance of using a detailed enough and adequate structured dynamic HSMDM model linking the metabolic cellular processes and the bioreactor state-variables for engineering evaluations of the target process performance. Such a modular hybrid model can link the macro-scale (bioreactor liquid-phase) process variables to the nano-scale (cellular) ones.”
The structured HSMDM model not only can be used for the SBR optimization, “but can also be a valuable tool to evaluate the cellular metabolic fluxes (i.e. the homeostatic metabolic reaction rates, not evaluated here), thus opening the possibility to in silico re-design the cell metabolism to obtain GMO-s with industrial or medical applications [1,2,4,5,20,30,32,43-47,60,75-77,112]. Thus, the large experimental and computational effort to validate such structured cell models is eventually fully justified through the practical advantages offered by such an engineering analysis. It is also to be emphasized that such a modular and structured approach of the dynamic cellular models via HSMDM offers the possibility to study the interference of the CCM sub-process (e.g. glycolysis, and AA synthesis here), together with the influence of the external conditions. Such a modular simulation platform presents the advantage to be easy to extend by the inclusion of new CCM modules.”
Case study no. 2. The Use of a HSMDM Modular CCM Cell-Scale Structured Kinetic Model Coupled with a FBR Dynamic Model (Including Macro-Scale State Variables) to in-Silico Off-Line Maximize the TRP Production
Abbreviations and notations used in this section 3

Generalities about the TRP synthesis bioprocess
In general, the HSMDM models can be further used as the core of a modular dynamic model used to simulate the CCM and regulation of various metabolite syntheses, with application to in silico reprogramming of the cell metabolism to design GMO of various applications [4,5,7,20,43,112]. One example, detailed in this section is the in-silico off-line optimization of the operating conditions of a fed-batch bioreactor (FBR) with GMO E. coli to maximize the production of tryptophan (TRP). Thus, compared to a simple batch bioreactor (BR) using a wild E. coli cell culture, the TRP production was increased with 73% (50% due to the novel design GMO E. coli strain, and 23% due to the model-based optimization of the variable feeding of the FBR) [30,43-47,60,66,] An exceptional example of multiple applications of extended structured HSMDM dynamic models is offered by Maria [30,60]. As exemplified in the Part-1, and Part-2 of this work, and by Maria [4,5,112] hybrid kinetic models, linking structured cell metabolic processes to the dynamics of macroscopic variables of the bioreactor, are more and more used in the engineering evaluations to derive more precise predictions of the process dynamics under variable operating conditions. Depending on the cell model complexity, such a math tool can be used to evaluate the metabolic fluxes in relationships to the bioreactor operating conditions, thus suggesting ways to genetically modify the micro-organism for certain purposes. Even if development of such extended dynamic MSDKM or HSMDM models requires more intensive experimental and computational efforts, their use is advantageous, as proved by the Parts 3 and 4 of the work, and by the examples offered by [4,5,112].
The approached probative example of this section refers to a
HSMDM model able to simulate the dynamics of nano-scale variables
from several pathways of the central carbon metabolism
(CCM) of E. coli cells, linked to the macroscopic state variables of a
fed-batch bioreactor (FBR) used for the tryptophan (TRP) production.
Based on this model, and other classical in-vitro rules, the used
E. coli strain was in-silico, and experimentally modified to replace
the PTS-system for glucose (GLC) uptake (Figure 12) with a more
efficient one, based on galactose permease/glucokinase (GalP/Glk).
The study, detailed by [30,60] presents multiple elements of novelty,
as summarized as follows:
a) The experimentally validated modular HSMDM model itself,
and
b) Its efficiency to in-silico derive an optimal operation policy of
the studied FBR, with a higher accuracy compared to the classical
empirical (heuristically) optimization rules using apparent
unstructured kinetic models of the bioprocess [7,9,62].
Over the last decades, there is a continuous trend to develop more and more effective bioreactors [9,80] to industrialize important biosyntheses for producing fine-chemicals used in the food, pharmaceutical, or detergent industry, by using free-suspended or immobilized cell cultures in suitable bioreactors, as reviewed by Maria [7]. The batch (BR), semi-batch (SBR), fed-batch (FBR), or a serial sequence of BR-s [116], or the continuously operated fixed-bed, or three-phase fluidized-bed bioreactors (with immobilized biocatalyst), etc., are successfully used to conduct biosyntheses aiming to replace complex chemical processes, energetically intensive and generating toxic wastes [6,7,24,45,60]. Among applications, it is to mention fermentative processes for production of organic acids, alcohols, vinegar, amino-acids (TRP, cysteine, lysine, etc.), proteins, yeast, hydrogen, food products, and food additives [14,117], recombinant proteins (monoclonal antibodies) [7], etc., by using bioreactors with microbial (cell) cultures, or enzymatic reactors [6,9], by integrating genetic and engineering methods [18,19].
Bioreactors with microbial / animal cell cultures (suspended or
immobilized) have been developed in simple or complex constructive
/ operating alternatives as reviewed by [7,14,118], to mention
only few of such review works. In spite of their larger volumes, the
continuously mixing aerated tank reactors (CSTR), operated in BR,
SBR, FBR, or continuous modes, are preferred for bioprocesses
requiring a high oxygen transfer, and a rigorous temperature/pH
control. This is why; an effective FBR was used in the approached
case study for TRP production, as being more flexible as operating
regime alternatives. From the engineering point of view, in addition
to the production capacity optimization, there are several important
problems to be addressed, that is:
a) The key-point in screening among bioreactor alternatives and
operating modes. The answer to this problem is related to the
maintenance of the bioprocess optimal conditions that ensure
a high biomass activity (free or immobilized on a suitable porous
support), by supporting its growth to compensate its natural
biodegradation, and the risk to disintegrate the biomass
flocks or the support through mechanical shearing induced by
the mixing, thus leading to the biomass leakage and washout.
b) Development of optimal operating policies of the adopted/given
bioreactor, based on an available process dynamic (kinetic)
model (extended or reduced) derived from on-/off-line measurements.
The model-based optimal operation of the bioreactor can be
applied in two ways:
1. ’off-line’, in which an optimal operating policy is in-silico determined
in-advance by using an adequate kinetic model (usually a
deterministic one, based on the process mechanism), previously
identified from separate experiments; in this alternative, extended/
complex dynamic models of the bioprocess/bioreactor of HSMDM
type can be used, not being restricted by the ’real-time’ application,
and
2. ’on-line’, with using an extremely simplified dynamic model (an
apparent/global empirical one, often of a simple polynomial form)
of the bioprocess/bioreactor, and a classic state-parameter estimator,
based on the on-line recorded data.
Of course, the alternative (2), even if simpler and with a ’real- time’ application is very approximate, being often inadequate, thus requiring laboriously frequent (during bioreactor operation) empirical model updating [31,119-123].
The current (default) approach to solve the model-based design, optimization and control problems of the industrial biological reactors is the use of unstructured (global) models of Monod type (for cell culture reactors) or of Michaelis-Menten type (if only enzymatic reactions are retained) that ignores detailed representations of cell processes [4,5,8,9,124-126]. See an example given by Maria [4,5,37-40] for the mercury uptake in a fluidised-bed bioreactor using immobilized GMO E. coli. As underlined in the Part-1 of this work, the applied engineering rules are similar to those used for chemical processes (CBE), and inspired from the NSCT [4,31,124- 134]. However, by accounting for only key process variables (biomass, substrate and product concentrations), these global kinetic models do not properly reflect the metabolic changes, being unsuitable to accurately predict the cell response to environmental perturbations by means of (self-) regulated cell metabolism. The alternative is to use structured kinetic models, by accounting for cell metabolic reactions and component dynamics. Such deterministic models lead to a considerable improvement in the predictive power, with the expense of incorporating a larger number of species mass balances including parameters (rate constants) difficult to be estimated from often incomplete data and, consequently, difficult to be used for industrial scale purposes [1,2,4,5,37-40,135,136].
An alternative compromise, tested in the Parts 3 and 4 of this work, and by Maria [4,5,112], is to use hybrid dynamic math models, that is MSDKM and HSMDM models presented in the Part-1, and Part-2 of this work, developed by similarity to those used in the CBE, and in NSCT. These HSMDM models combine unstructured with structured process characteristics, linked to the macroscopic state variables of the bioreactor dynamic model, to generate more precise predictions of both cell nano-level state-variables, and macro- level bioreactor state-variables [1,2,4,5,37-40,137,138]. The idea of hybrid kinetic models is to inter-connect groups of process variables belonging to at least two hierarchical levels of model details. The resulted composite (hybrid) model is able to simulate the bioreactor dynamics simultaneously at various levels of detail. Thus, the dynamics of the bioreactor macroscopic state variables (i.e. species present in the liquid bulk) is simulated concomitantly to the nanoscopic variables describing the cell metabolic processes of interest, because the macro-/nano-scale variables are closely linked, as long as some cell metabolites are imported/excreted from/in the bioreactor bulk. Even if such a complex / extended dynamic model, including some complex cell metabolic pathways requires more experimental and computational efforts to be builtup and identified from structured kinetic data, the resulted hybrid (bi-level, macroscopic and nanoscopic) dynamic model presents major and remarkable advantages, as listed (no. i-ix) and discussed in the Part-1 of this work [4].
In fact, such a MSDKM hybrid structured cell dynamic model must include only the essential parts of the CCM (Figures 2, 13-17] by incorporating the pathway responsible for the target metabolite synthesis, and the lumped modules of the cell core, that is: the glycolysis, the GLC uptake system [i.e. the phosphotransferase (PTS), or an equivalent system, such as those based on the galactose permease/glucokinase (GalP/Glk)], the ATP-recovery system, the pentose-phosphate pathway (PPP), the tricarboxylic acid cycle (TCA), and other metabolic pathway modules (if necessary in simulations). See, for instance, [41,43-45,139] for more details.
A special interest has been granted to the accurate modelling of the glycolysis dynamics and its self-regulation [42,43,46,66] as long as most of the glycolysis intermediates are starting nodes for the internal production of lot of cell metabolites (e.g. amino-acids, SUCC, CIT; TRP) [7,41,44,45,60,]. This needs to have good quality MSDKM structured cell models to simulate the dynamics (and regulation) of the bacteria CCM became a subject of very high interest over the last decades, allowing in-silico design of GMO-s with desirable characteristics of various applications [1,2,4,5,135]. As a result, an impressive large number of valuable structured deterministic models (based on a mechanistic description of the metabolic enzymatic reactions tacking place among individual or lumped species) have been proposed in the literature to simulate the cell CCM dynamics, with including tenths-to-hundreds of key species. Here, it is worth mentioning the E. coli model of Edwards and Palsson [140] used by Maria [41,42,67,71,141-143] for various purposes, or the S. cerevisiae glycolysis model of Teusink et al. [144], or the JWS platform of Olivier and Snoep [113], and the MPS platform of Seressiotis and Bailey [145] to simulate cell metabolism (dynamics and/or fluxes), to mention only few of them. Simulation platforms, such as E-cell [146,147], or V-cell [148], accounting for thousands of species and reactions, display extended capabilities to predict the dynamics of the cell metabolism under various conditions, based on EcoCyc, KEGG, Prodoric, Brenda and other bio–omics databanks (review of Maria [1,2,4,5,135]). A worthwhile CCM-based dynamic or stationary models were reported by Maria [4,5,41,42,60] and schematically represented in (Figures 2, 13-17). Deterministic MSDKM kinetic models using continuous variables has been developed by Maria [42] for the glycolysis, and by [61,67,94-96,149] for parts of the CCM. Such models can adequately reproduce the cell response to continuous perturbations, the cell model structure and size being adapted based on the available bio–omics information.
In spite of such tremendous modelling difficulties, the development of structured reduced deterministic (rather than stochastic) models [1,2,4,5] able to adequately reproduce the dynamics of some CCM complex metabolic syntheses [42,77,76], but also the dynamics of the genetic regulatory circuits (GRC-s) [1,2,4,5] tightly controlling the metabolic processes reported significant progresses over the last decades [150,151]. Even if they are rather based on sparse information from various sources, unconventional statistical identification, and lumping algorithms [1,2,4,5,86-88], such MSDKM structured reduced deterministic kinetic models have been proved to be extremely useful for in-silico analyse and characterize the cell CCM, dynamics, but also the stationary metabolic fluxes, useful for designing novel GRC-s and GMO-s conferring new properties/ functions to the mutant cells [1,2,4,5,152].
In spite of such tremendous modelling difficulties, the development of structured reduced deterministic (rather than stochastic) models [1,2,4,5] able to adequately reproduce the dynamics of some CCM complex metabolic syntheses [42,77,76], but also the dynamics of the genetic regulatory circuits (GRC-s) [1,2,4,5] tightly controlling the metabolic processes reported significant progresses over the last decades [150,151]. Even if they are rather based on sparse information from various sources, unconventional statistical identification, and lumping algorithms [1,2,4,5,86-88], such MSDKM structured reduced deterministic kinetic models have been proved to be extremely useful for in-silico analyse and characterize the cell CCM, dynamics, but also the stationary metabolic fluxes, useful for designing novel GRC-s and GMO-s conferring new properties/ functions to the mutant cells [1,2,4,5,152].
The case study presented in this chapter uses a hybrid dynamic
HSMDM model built-up by [60] by linking a CCM-based structured
kinetic model with a FBR ideal dynamic model. The resulted hybrid
(bi-level) FBR model was used to in-silico determine the optimal
(time step-wise) feeding policy of the FBR used by Chen et al. [63]
to study the TRP-synthesis by using a genetically modified design
E. coli T5 strain culture. The thus obtained optimal operating policy
of the FBR has proven to be very effective, by ensuring maximization
of the TRP production with involving only two key control
variables, that is:
a) The variable feed flow-rate FL,j (j = 1,…, Ndiv), and
b) The variable feeding GLC concentration cfeedglc,j (j = 1,…,
Ndiv)
Where Ndiv = 5 are the ’time arcs’, that is the equal time-intervals
in which the batch-time (tf) was divided. During each ’time-arc’
(of equal lengths), the control variables are kept constant at optimal
values determined from solving the below described optimization
problem (i.e. maximization of the TRP production in this case).
The obtained optimal operating policy of the approached FBR, by
using the extended HSMDM model, reported better performances
compared to the not-optimally operated FBR of Maria [45,60], or of
Chen [62]. The structured modular kinetic model of Maria [42,60]
used in this numerical analysis includes four inter-connected modules
characterizing the dynamics of the concerned cell CCM-pathways
involved in the TRP-synthesis, that is:
a) Module [A] – glycolysis (inside cell);
b) Module [B] – ATP recovery system (inside cell);
c) Module [C] – TRP synthesis (that is the TRP-operon expression
inside cell);
d) Module [X] – the suspended biomass growth (outside cell).
This cellular structured bioprocess HSMDM model was experimentally identified, and checked over extensive experiments conducted by several authors, that is [42,43,67,76] for the glycolysis, and by Chen et al. [62,63], and by Maria [60] for the TRP synthesis. Experimental data of Chen [62] for the TRP-synthesis are also used to validate the predictions of the hybrid HSMDM model [30,60].
The present study presents multiple elements of novelty, as followings:
a) Although production of TRP by engineered E. coli has been extensively
studied, the need of multiple precursors for its synthesis
and the complex regulations of the biosynthetic pathways
make the achievement of a high product yield still very
challenging [60]. This engineering problem was solved here by
using a model-based (in-silico) approach, completed with a biological
improvement of the used E. coli cell culture;
b) The derived optimal operating policy of the FBR is given on
time-intervals (the so-called ‘time-arcs’) of equal length, and of
a reduced number to be easily implemented. The control variables
present optimal but constant levels over each time-arc
(different between time-arcs) during the FBR operation.
c) The used biomass culture refers to a GMO E. coli T5 strain. The
characteristics of this strain were reflected in the rate constants
estimated by Maria [60]. This T5 strain was produced by
[63,153] to increase the TRP production in their bench-scale
FBR. Chen et al. [62,63,153] performed genetic modifications
of the TRP producer ’wild’ strain S028. Basically, by using a
simplified MSDKM model, to determine the key-fluxes of interest
(Figure 12) they remove the PTS import-system of GLC of
the ‘wild’ strain by replacing it with a more effective one based
on the galactose permease/ glucokinase (GalP/Glk) uptake
system, by modulating the gene expression of GalP/Glk. The
resulted T5 strain showed an increase of the specific TRP production
rate in a non-optimal FBR by 52.93% (25.3 mg/gDW
biomass /h) compared to the initial strain [63], and by ca. 70%
if the used FBR is optimally operated (this case study).
d) The below simulations with the extended HSMDM model of
Maria [30,60] reveal the close link between the cell key-metabolites
dynamics and the FBR operating conditions.
e) The used hybrid bi-level kinetic HSMDM model is enough
complex to adequately represent the dynamics of the FBR
state-variables, that is: the biomass [X] growth in the bulkphase,
the GLC depletion in the bioreactor liquid-phase, the
excreted TRP dynamics in the bulk-phase, and the dynamics of
the excreted PYR, but also the dynamics of the cell key-species
involved in the concerned reaction pathway modules, that is:
a) Glycolysis,
b) Atp-recovery system,
c) Trp-operon expression.
The design/checked E. coli GMO strain
One of the aims of developing complex structured HSMDM models is to in-silico design GMO cells of desired characteristics. That is because, a central part of cell metabolic math (kinetic) models concerns self-regulation of the metabolic processes via GRC-s, and the CCM essential modules dynamics. Consequently, one particular application of such dynamic cell MSDKM or HSMDM models is the study of GRC-s, and modules of CCM in order to predict ways by which biological systems respond to signals, or environmental perturbations. The emergent field of such efforts is the so-called ‘gene circuit engineering’ (GCE), that is a part of the Synthetic Biology (see the Part-1 of this work [4]), and a large number of examples have been reported with in-silico re-creation of GRC-s conferring new properties/functions to the mutant cells. Thus, Synthetic Biology was defined as “putting engineering into biology” [78]. This emerging field is strongly linked to the systems Biology which, is one of the modern tools, that uses advanced mathematical simulation models for in-silico design of GMOs that possess specific and desired functions and characteristics. By using simulation of gene expression, the GCE realizes in-silico design of GMO–s that possess desired cell functions. By inserting new genes or knock-out some of them, modified GRC-s can be obtained inside a target micro-organism, thus creating a large variety of mini-functions / tasks (desired ‘motifs’) to the mutant (GMO) cells in response to external stimuli (see Parts 1 and 2 of this work [4]).
Although “production of TRP by engineered E. coli has been extensively studied, the need of multiple precursors for its synthesis, and the complex regulations of the biosynthetic pathways make the achievement of a high product yield still very challenging. The metabolic flux analysis of Chen [62,153,154] suggests that replacement of the PTS glucose uptake system in the wild E. coli with the galactose permease/ glucokinase (GalP/Glk) uptake system can double the TRP yield from glucose. Such a hypothesis was checked by using a simplified MSDKM model to determine the wild and GMO cellular fluxes (Figure 12). Eventually, the effectiveness of this GMO was in-silico proved by Maria [30,60]. Finally, starting from these in-silico trials, and from a metabolic fluxes analysis, Chen et al. [62,63,153,154] experimentally obtained a promising GMO E. coli T5 strain which, tested in a bench-scale pilot FBR proved an increased GLC import capacity, together with an increased TRP yield by ca. 20% compared to an initial mutant S028 strain (that is 0.164 vs. 0.137 g TRP/g GLC), while the specific production rate was increased by 53% [63]. The cell flux analysis of Chen [62,153] indicated the doubling of fluxes responsive for the TRP synthesis. Finally, a highly productive strain T5AA resulted, with a TRP production rate of 28.83 mg/gDW/h” [62,63,154,155]. More details on E. coli mutants presenting alternative routes for GLC uptake are given by [62,63,154-158].
Experimental FBR bioreactor and the recorded kinetic data
To estimate the rate constants of the HSMDM hybrid structured kinetic model developed in this section 3 for the studied TRP synthesis with using the modified E. coli T5 strain of Chen et al. [62,63,153], Maria [60] used the experimental kinetic data of Chen [62] obtained in a bench-scale three-phase (G-L-S) FBR operated under the so-called ’nominal’ (non-optimal) conditions displayed in (Table 1). The completely automated FBR of 1.5 L capacity includes a large number of facilities described in detail by Chen [62] (Figures 13-17). The nominal non-optimal operation of this bioreactor means addition of a controlled constant feed flow-rate of substrate solution (GLC) of a constant concentration, together with nutrients, additives (for the pH control), anti-bodies, etc. in recommended amounts (Table 1) along the entire batch. A reduced FBR scheme can be found in the (Figure 18). To obtain kinetic data, samples have been taken from the FBR bulk during the batch (63 h), with a certain frequency (2 to 5 h), thus determining the concentration dynamics of the key-species of interest, that is: X (biomass), GLC, TRP, PYR. These recorded data are presented in (see the blue points of Figures 7,9-11). Concerning the analytical techniques used to derive such measurements, the reader is referred to the work of Chen [62] (see also the Acknowledgement of Maria and Renea [30]).”
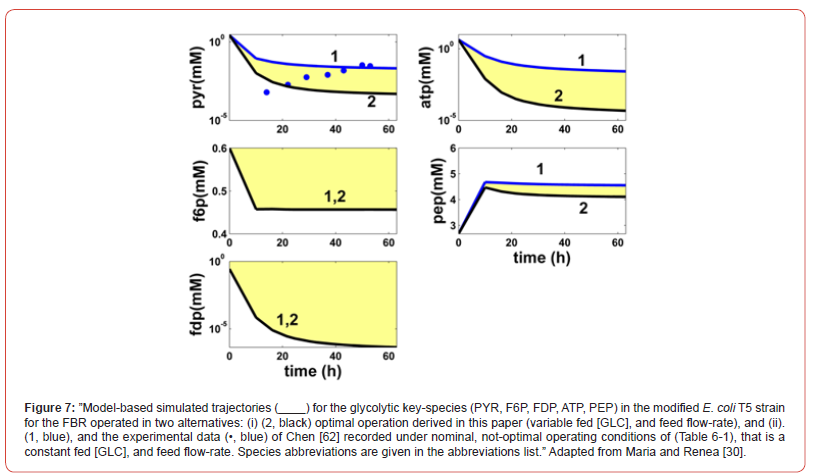
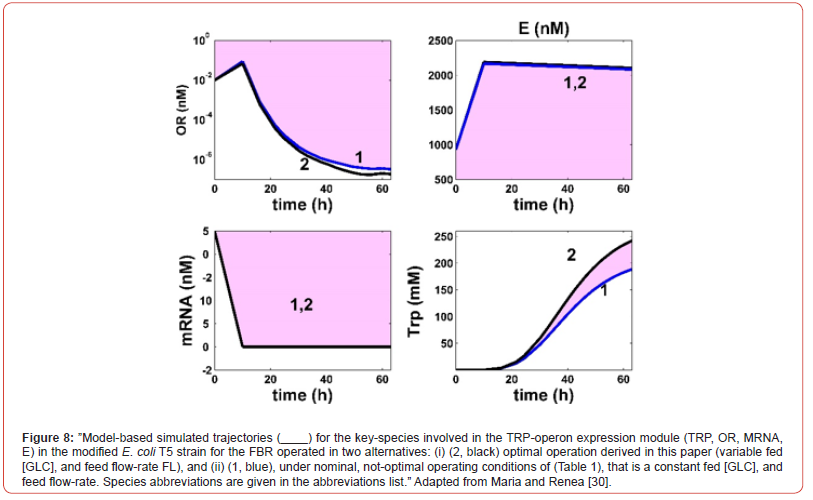
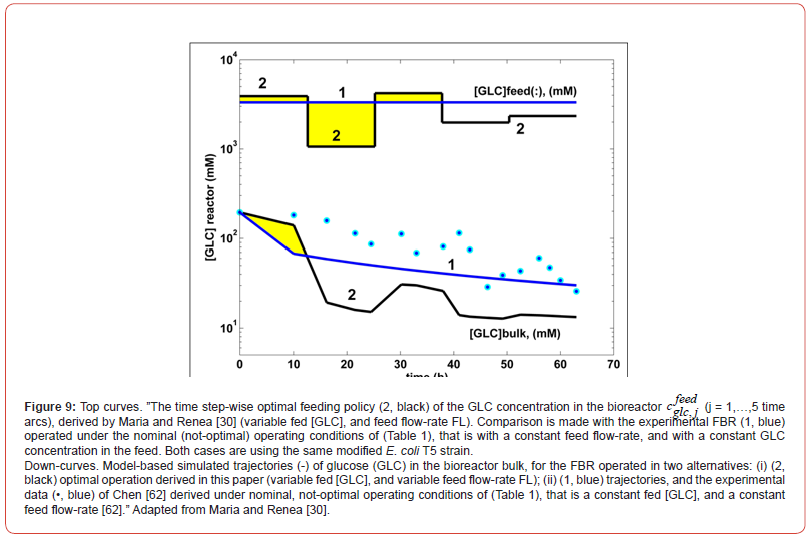
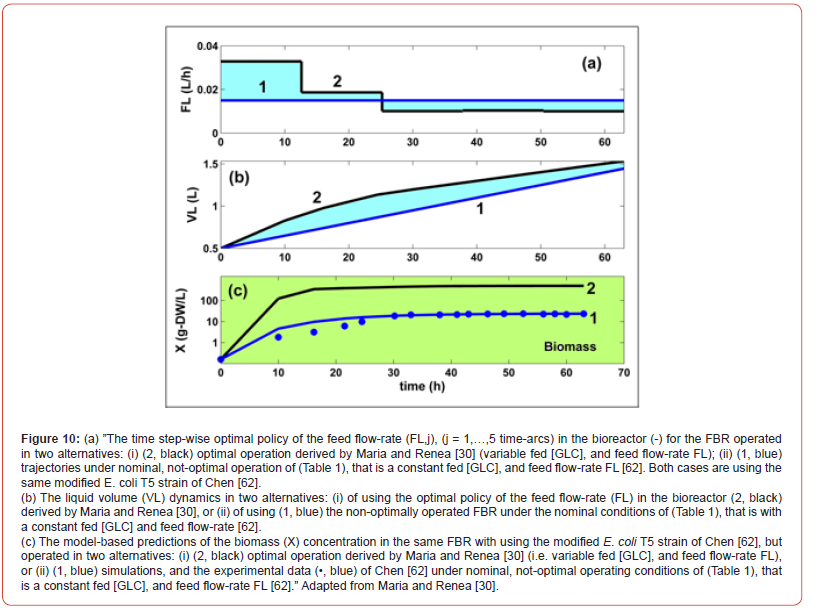
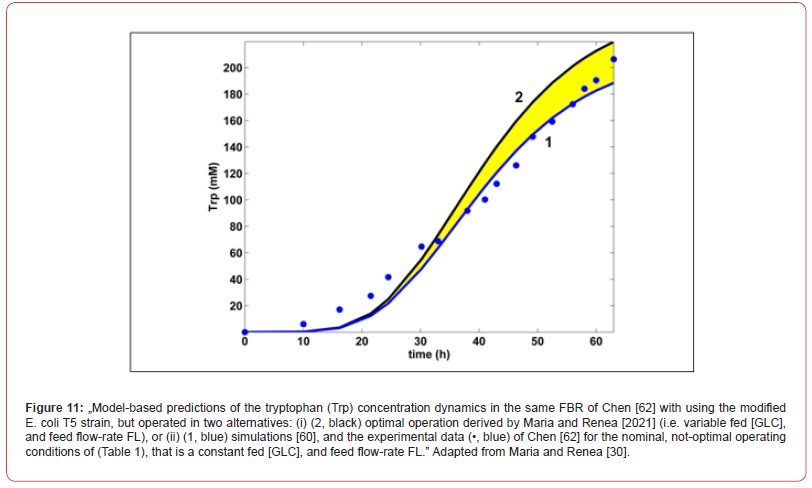
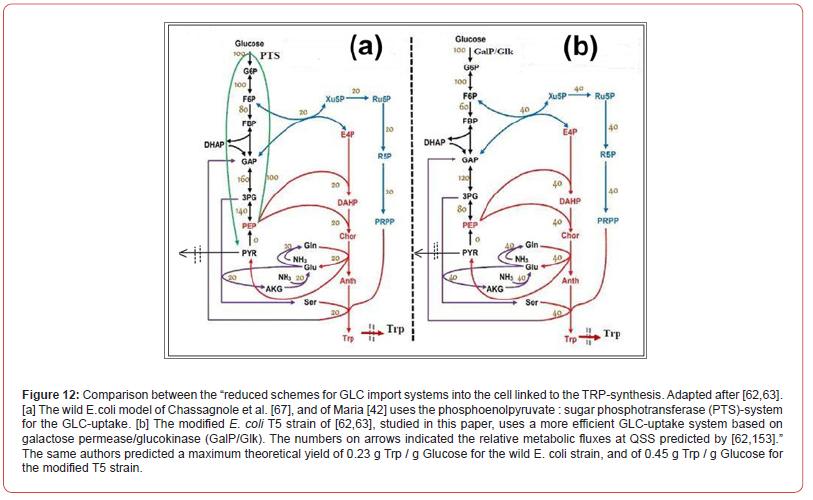
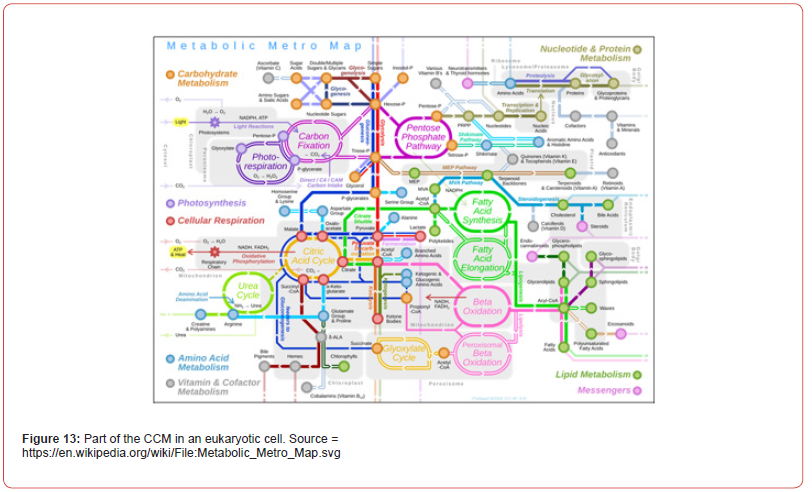
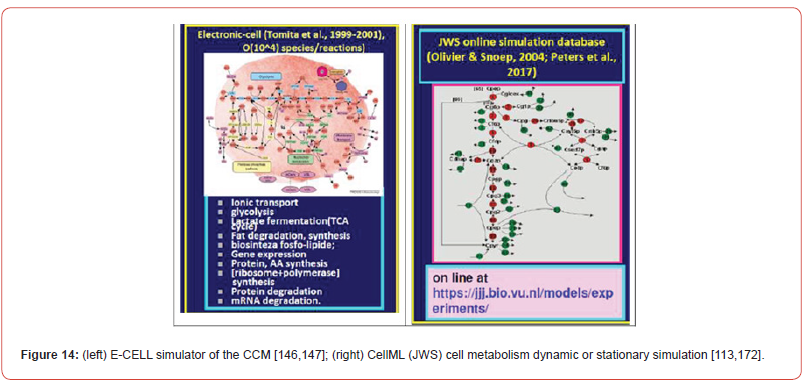
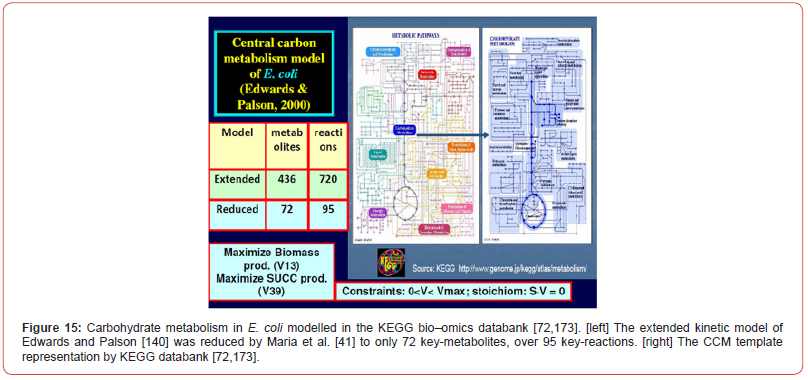
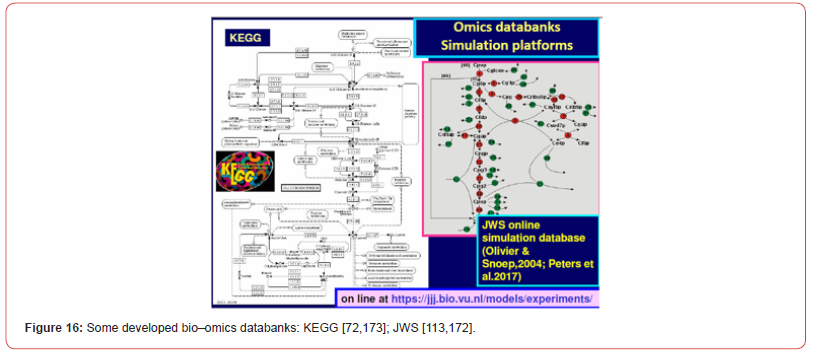
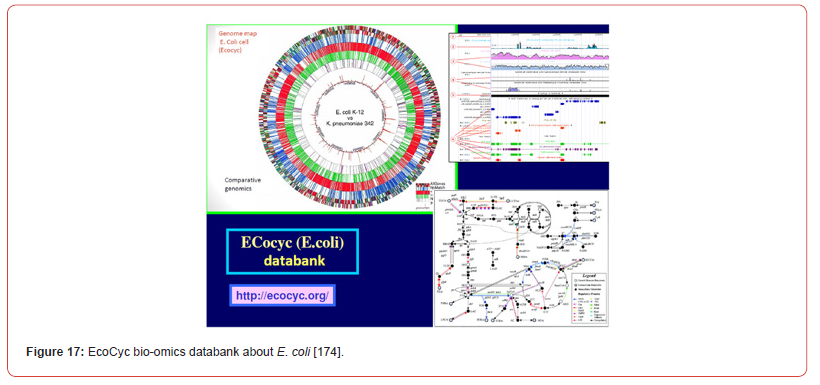
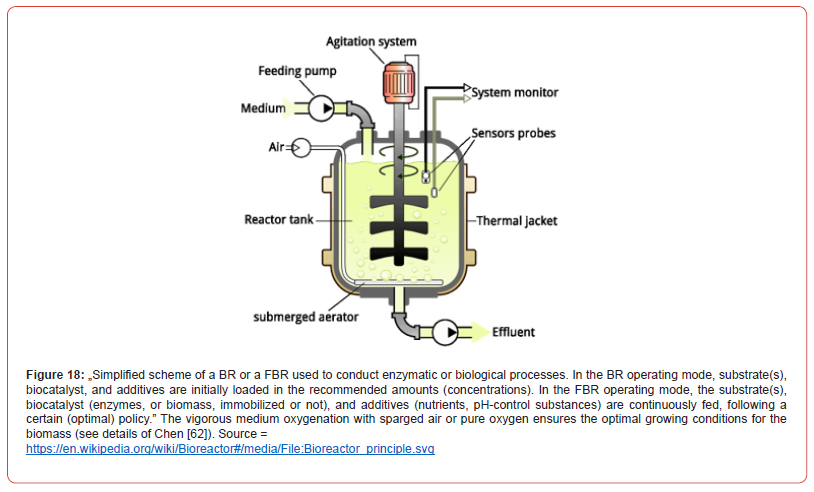
Structured dynamic HSMDM model for TRP production in a FBR
The HSMDM model developed by Maria [60], and valorized for
engineering purposes by Maria and Renea [30] is a hybrid (bi-level)
model including two inter-connected parts, that is:
a) One ’classical’ part is simulating” the dynamics of the bioreactor
macroscopic state variables (i.e. Species present in the
liquid bulk) and,
b) One structured part is simulating the dynamics of the nanoscopic
variables describing the cell metabolic processes of interest
(for the ’wild’, or for the T5AA strain GMO E. Coli).
All these simultaneous dynamic simulations at various levels of detail are based on the ODE differential mass balances of the macroscopic state variables. Dynamic simulation of the two above parts (a-b) of the HSMDM model is mandatory to be performed concomitantly, because the macro-/nano-scale variables are closely linked and inter-related, as long as some cell metabolites are imported/ excreted from/in the bioreactor bulk. Even if such a complex / extended dynamic model, including some complex cell metabolic pathways requires more experimental and computational efforts to be built-up and identified from structured kinetic data, the result ed hybrid (bi-level, macroscopic and nanoscopic) dynamic model presents major and remarkable advantages, as listed (no. i-x) and discussed in the Part-1 of this work [4,5].
The both parts (a-b) of this HSMDM dynamic model are briefly presented, module after module. For more details and an extended discussion, the reader is directed to the works [30,60]. Being a metabolite of high practical importance, intense efforts have been invested to decipher the TRP synthesis regulation mechanism in various micro-organisms, for deriving an adequate dynamic model of its QSS or oscillatory synthesis to be used for engineering purposes. Some results about the TRP-operon expression includes the deterministic kinetic models of Maria et al. [44], and of Bhartiya et al. [64], while other studies [61] are rather focus on determining correlations between cell flux distribution, the flux control, and the optimized enzyme amount distribution, but employing a too reduced MSDKM kinetic model, not able to simulate most of the CCM reaction pathways, and the cell metabolic process dynamics. The TRP synthesis regulation being a very complex process, a significant number of simplified kinetic models with lumped terms (species and/or reactions) have been proposed in the literature (see the reviews of Maria et al. [1,2,4,5,44-47]). Kinetic modelling of this complex process is even more difficult because, as proved by [43,44-46,65,159,160], under certain FBR operating conditions, the TRP-synthesis can become an oscillatory process. Oscillations in the TRP synthesis are produced due to the concomitant activation and high order repression of the TRP-operon expression, together with a nonlinear demand for end product, making its expresses to be cyclic. The cell growth and dilution rates, related to the cell cycle, and the liquid residence-time in a SBR/FBR, strongly influence the TRP system stability, as in-silico proved by Maria [43-46,66].
The adopted HSMDM hybrid kinetic model is those of Maria
[60] built-up using the kinetic data of Chen [62] collected in a FBR
operated under the nominal (not-optimal) conditions of (Table 1),
with using the GMO T5 strain of E. coli. This complex HSMDM structured
kinetic model presented in (Table 2B, Table 3, and Table 4)
is a deterministic one. The CCM-based model core is the glycolysis
dynamic model of Maria [42], validated by using literature data. To
keep the bi-level HSMDM hybrid model of Maria [43,60] adapted
here of a reasonable extension, but also to facilitate estimation of its
rate constants, this dynamic model accounts for only the key-species
included in four linked cell reaction modules responsible for the
TRP-synthesis, as followings: three structured modules {[A], [B],
[C]} concern some essential CCM cell processes (Figure 3 for {[A],
[B], [C]}, and Figure 19 for {[A]} ); the fourth kinetic module concerns
the biomass [X] growth dynamics in the FBR bulk. These inter-
connected four modules are also integrated in the FBR dynamic
model, as followings.
a) Module [A] - glycolysis with a modified GLC-uptake system
(due to the used modified E. coli T5 strain) (Figure 19);
b) Module [B] - ATP-recovery system. The pink rectangle in (Figure
3);
c) Module [C] - TRP-operon expression. The gray rectangle in
(Figure 3)
d) Module [X] - The biomass growth kinetic model (in the FBR
bulk-phase).
Table 3:The TRP synthesis kinetic model of [44,60] modified to be coupled with the glycolysis model [30,66]. Model parameters are given by Maria [44,60]. “Species mass balances in the TRP- operon expression kinetic model of Bhartiya et al. [64] were modified by Maria [44,60] to better fit the experimental data of Chen [62], as followings: i) PEP (from glycolysis) is the substrate of TRP-synthesis, and the node coupling this synthesis with the glycolysis module; ii) a novel model for the TRP-synthesis inhibition was proposed and identified from experiments. The model rate constants are estimated” by [Maria, 2021] to fit the experimental data of [Chen, 2020] (see the Figs. 4,6-8 of Maria and Renea [30] ) collected in a FBR with using the modified E. Coli T5 strain, and the “nominal” operating conditions of (Table 1). Notations: TRP = tryptophan; OR = the complex between O and R (aporepressor of the TRP gene); OT = total TRP operon; MRNA = tryptophan mRNA during its encoding gene dynamic transcription, and translation; E = enzyme anthranilate synthase; T = TRP.; QSS = quasi-steady-state.
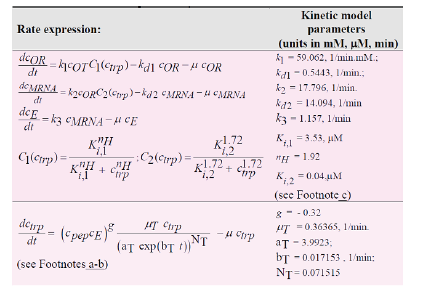
Footnotes: (a) “The adopted modification for the TRP-synthesis inhibition replaces the C3 variable of Bhartiya et al. [64] model (not displayed here) with a modified Contois model, with including a power-law inhibition with TRP-growth at the denominator. (b) The nitrogen source in the TRP synthesis is considered in excess and included in the constant. To be connected to the glycolysis kinetic model, the PEP species dynamics, generated by the glycolysis model, was explicitly included in the TRP synthesis rate as a substrate” [60]. (c) The initial concentrations of the TRP-operon species (OR, MRNA, E, TRP) are given in (Table 1).
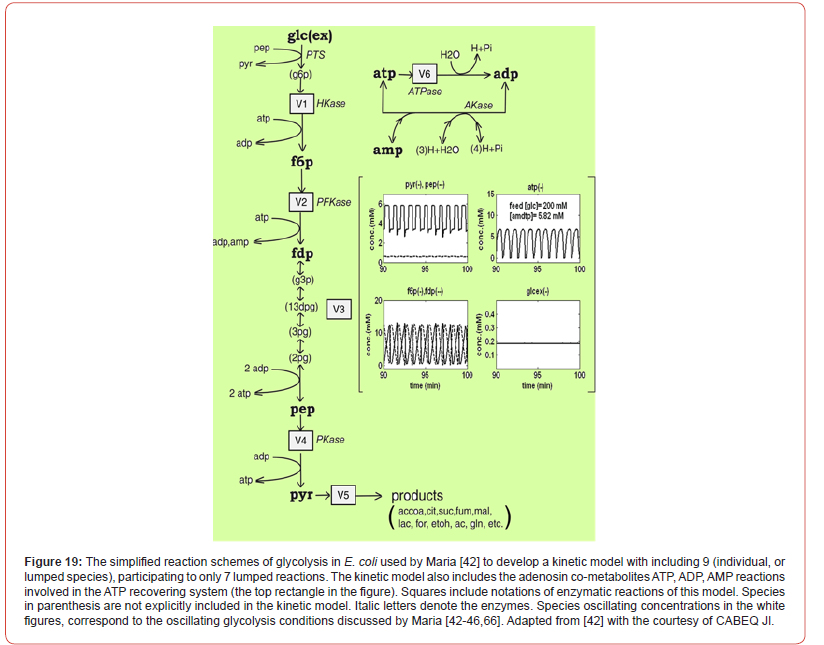
Macroscopic FBR module - This classic model describes the dynamics of the bioreactor state variables of interest (GLC, X, TRP, PYR, V). A brief description of these parts of the HSMDM hybrid model is presented below. For more details, the reader should consult the works of Maria [30,43,60].
The biomass [X] growth model
”The cell culture in the bioreactor is considered to be homogeneous, and introduced as a lump [X] in the FBR model of (Table 2B), of concentration Cx. A modified Contois model, adjusted by considering a power-law inhibition with the 1-st order growing biomass at the denominator [161], was proved to be the most adequate vs. the experimental data of (Figure 10C). At this model simulation stage, simulations of the biomass dynamics over the batch have been performed by using the experimentally recorded [X(t), and GLC(t)] species trajectories (of Chen [62]), interpolated with the cubic splines functions (INTERP1 facility of MatlabTM package). The estimated rate constants for this module are given in (Table 2B). The [X] module is connected to the other cell processes, by influencing the GLC dynamics in the bulk phase through the X-growth rate (Table 2B) that, in turn, influences the GLC import flux V1 into the cell (Table 4, Figure 19, and Figure 3).”
Module [A] - Glycolysis
In short, ”glycolysis module is a determined sequence of ten enzyme-catalyzed reactions (see the reduced pathway of (Figure 3), and of (Figure 19) with only 9 (individual, or lumped species), participating to only 7 lumped reactions of Maria [42]) that converts glucose (GLC) into pyruvate (PYR). The free energy released by the subsequent TCA originating from PYR is used to form the high-energy molecules ATP, and NADH that support the glycolysis and most of enzymatic syntheses into the cell [79], by means of QSS or oscillating processes, most of them induced by the oscillating glycolysis conditions discussed by Maria et al. [42-47,66,68]. Adequate modelling of the glycolysis dynamics is important because the glycolytic intermediates provide entry/exit points to/from glycolysis. Thus, most of the monosaccharides, such as fructose or galactose, can be converted to one of these intermediates, further used in subsequent pathways. For example, PEP is the starting point for the synthesis of essential amino acids (AA) such as tryptophan (TRP), cysteine, arginine, serine, etc. [44,67,81,110]. Due to the tremendous importance of the glycolysis in simulating the cell CCM, intense efforts have been made both in its experimental study, and in modeling the dynamics of this process specifically in bacteria (see the short reviews [42,43,162]). The large number of glycolysis reduced or extended kinetic models proposed in the literature [42] present a complexity ranging from 18-30 species, included in 48- 52 reactions, with a total of 24-300 or more rate constants. Most of these models are however too complex to be easily identified from (often) few available kinetic data, and too complex to be further used for engineering calculations. Beside, with few exceptions, most of them cannot satisfactorily reproduce the glycolytic oscillations occurrence on a mechanistic basis” [42,43,46].
Table 4:Reaction rate expressions V1-V6 of the hybrid model of (Table 2-B), describing the dynamics of the cellular glycolytic species according to the kinetic model of Maria [42,60], and of Chassagnole et al. [67]. In the present study, this glycolysis kinetic model was modified by replacing the PTS system (V1 flux) for the GLC uptake with those of the mutant T5 E. Coli strain tested by Maria and Renea [30]. The model rate constants were estimated by Maria [60] to fit the experimental data of Chen [62] presented in (Table 1 and Figures 7, 9, 10). Species abbreviations are given in the abbreviation list.
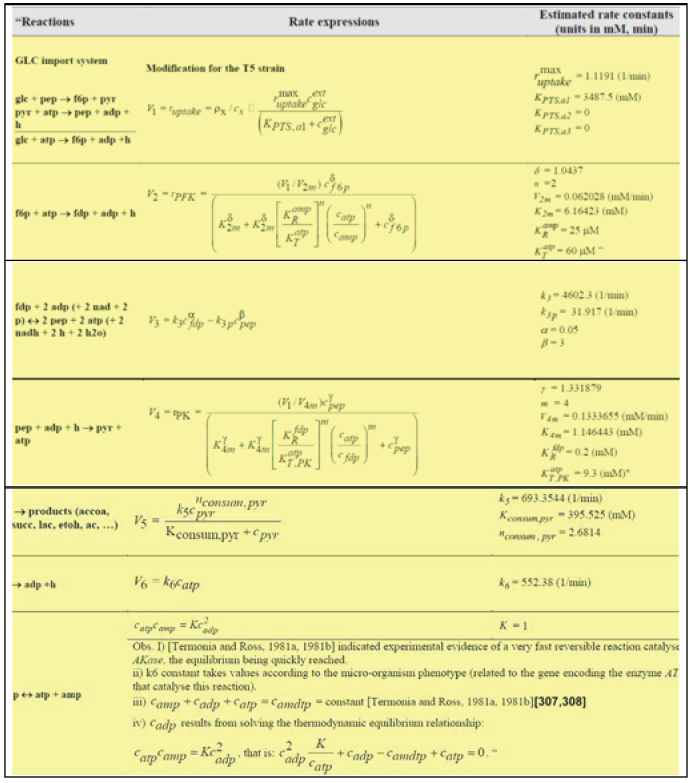
The adopted glycolysis kinetic model of Maria [42,43] even if
of a reduced form (denoted by MGM), “by accounting only for 9
key-species in lumped reactions with including 17 easily identifiable
rate constants belonging to V1-V6 metabolic fluxes (Figure
19, Figure 3, Table 2B, and Table 4) has been proved to adequately
reproduce the cell glycolysis under steady state, oscillatory, or transient
conditions depending on:
a) The defined glucose concentration level/dynamics in the bioreactor
bulk (liquid) phase,
b) The total a(mdt)p
cell energy resources, and
c) The cell phenotype characteristics related to the activity of
enzymes involved in the atp utilization and recovery system
{here denoted as module [B]}.
A detailed discussion about the operating conditions leading to glycolytic oscillations are extensively presented by Maria [43-46]. This is why, the FBR and the glycolysis dynamic models have to be considered together in the whole HSMDM hybrid model (Table 2B, and Table 4) when simulating the dynamics of the [GLC] in the FBR bulk-phase, and of the cell metabolites of interest {F6P, FDP, PEP, PYR, ATP, TRP-operon expression} into the cell. The adopted rate expressions for the glycolysis main fluxes V1-V6 presented in (Table 2B, and Table 4) are those of the basic model, excepting those of the GLC import system (V1), modified to match the T5 GMO E. coli strain kinetic data [60]. It is worth mentioning that, even if not always the case here, under certain conditions (that is external/environmental, and internal/genomic factors), glycolysis and TRP-synthesis can become oscillatory processes” [42,44-46,68]. According to the experimental data, the produced TRP (that is the denoted Module [C] here) is excreted (Figure 3) through a process described by Chen [62]. The PYR key-metabolite concentration in the cell is regulated through complex mechanism [163,164], the excess being excreted, as experimentally proved by Chen [62].
The MGM rate constants have been identified by Maria [42]
with using the experimental kinetic data of [67,76] obtained from
a FBR including a ’wild’ E. coli culture, operate with ’pulse-like’ addition
of the substrate (GLC). When using the modified E. coli in
the FBR, Maria [60] adjusted the MGM rate constants by using the
{GLC, TRP, PYR, X} experimental kinetic curves recorded over the
FBR batch (TRP, and PYR, being two excreted metabolites by the
cells in the growing medium). The MGM model has been proved to
adequately reproduce the cell glycolysis under steady state, oscillatory,
or transient conditions according to:
a) The defined glucose concentration dynamics in the bioreactor,
b) The total A(MDT)P cell energy resources;
c) The cell phenotype characteristics (related to the activity of
enzymes involved in the atp utilization and recovery system)
[30,43-47,60].
Here A(MDT)P denotes the lump of the following species: ATP = adenosin-triphosphate; ADP = adenosin-diphosphate; AMP = adenosin-monophosphate. This is why, the FBR and the MGM glycolysis dynamic models have to be considered together [60] when simulating the dynamics of the [GLC] in the FBR bulk-phase, and of the cell metabolites of interest {F6P(fructose-6-phosphate), FDP (fructose-1,6-biphosphate), PEP(phosphoenolpyruvate), PYR(Pyruvate), ATP} into the cell. The adopted rate expressions for the glycolysis main metabolic fluxes V1-V6 in the here discussed HSMDM hybrid model are those of the basic MGM model (Table 4).”
Module [B] - the ATP recovery system
As revealed by the reactions figured in the pink rectangle of (Figure 3), “the efficiency and the dynamics of the ATP recovery system is essential for the reaction rates of the whole CCM, as long as ATP plays a catalytic-chemical energy provider role. As underlined by Maria et al. [43-46], among the involved parameters, an essential factor is the k6 reaction rate (determined by the ATP-ase characteristics in Figure 3) and included in the glycolysis model of (Table 2B, and Table 4). The involved enzymes characteristics are directly related to the cell phenotype (that is cell genomic) controlling the [AMDTP] total energy resources level. To not complicate the simulations, the [AMDTP] level was kept unchanged in the present analysis at an average value given in (Table 1), as suggested by Chassagnole et al. [67]. The adopted kinetic model for the glycolysis (that is the V1-V6 reaction rates expressions of (Figure 3, Table 2B, and Table 4), and the equilibrium relationships for the ATP-ADP-AMP system (V6, and equilibrium relationships) given in (Table 2B, and Table 4) were imported from the literature [42,43,60]). This kinetic model was validated by Maria [60], based on experimental checks to fairly represent the dynamics and the thermodynamics of the internal modules [A], and [B] also in the modified E. coli T5 strain. Maria [42,43] proved that this ATP recovery model fairly represent the dynamics and the thermodynamics of such an important internal module. Rate constants were identified concomitantly with those of module [A], in the same way.” As an observation, the two modules [A], and [B] are inter-connected by sharing the ATP species, while the module [A] and [X] are inter-connected by sharing {X, and GLC} species. Thus, the dynamics of species belonging to the three inter-connected modules {[A], [B], and [X]} can be simulated concomitantly, according to the reduced reaction pathway of (Figure 3).
Module [C] - TRP operon expression system
“The adopted in-silico evaluation of the TRP synthesis of Maria [60] is based on a simplified pathway of the TRP-operon expression, as displayed in (Figure 3), derived from various studies reviewed by Maria et al. [44]. Modelling the TRP synthesis on a deterministic (mechanism-based) approach is difficult because this cellular process is known as being, under certain conditions, a QSS, or an oscillatory one [43,44,64,65,159]. However, to avoid extended kinetic models, difficult to be estimated and used, most of the reduced dynamic models from literature do not distinguish the process components from the regulatory components, and lumped reactions/ species are considered instead, the regulatory performance being included via adjustable model parameters and terms. Kinetic models trying to reproduce the TRP-operon expression self-regulation [65,159] are too extended to be of use for engineering evaluations purposes (see the discussion of [2,4,5]).
The adopted dynamic model of Maria [60] for the TRP synthesis
(TRP-operon expression) is given in (Table 3). This kinetic model is
derived from those of Bhartiya et al. [64]. The operon expression
regulation terms (C1, C2) were kept unchanged. Only the TRP mass
balance was changed according to the below (i-iv) reasons. The rate
constants of the considered OR, mRNA, TRP, E key-species mass balances
were re-estimated by using the experimental kinetic data of
Chen [62] given in (Figures 7,9-11). The TRP mass balance of the
Bhartiya et al. [64] model was modified and re-estimated step-bystep
as followings:
a) An explicitly connection of the TRP-module to the glycolysis
module [A] pathway was introduced through the PEP precursor
sharing node (see Figure 3). Consequently, PEP is included
as a substrate in the TRP mass balance (dcTRP/dt) in (Table
3), while the PEP consumption term is also considered in the
PEP balance of the glycolysis model according to the recommended
fluxes ratios of Stephanopoulos and Simpson [110],
as a first guess (Table 2B). Analysis of this model suggests that
intensifying TRP synthesis clearly depends on the glycolysis
intensity (that is the magnitude of the average concentrations
of the glycolytic species), and on its dynamics (QSS, or oscillatory)
[42,44,46,47,66]. In fact, as remarked by [154,156],
the PEP precursor is the limiting factor for the TRP-synthesis.
Consequently, intense efforts have been made to increase its
production by glycolysis intensification. This can be realized
by optimizing the FBR operating policy (as in the present numerical
analysis of this section 3), and/or by using (also in this
analysis) GMO E. coli T5 strain culture of [62,63].
b) The TRP-synthesis model of Bhartiya et al. [64] (Table 3) includes
two terms for the TRP-product inhibition, that is the
C3-term (of allosteric-type), plus a Michaelis-Menten term.
Our tests proved that these terms do not adequately fit the
TRP experimental kinetic data of (Figure 11). This is why, the
product inhibition term in the TRP balance of (Table 3) has
been replaced by the most adequate Contois-type model, with
considering a power-law inhibition of the 1-st order growing
TRP at the denominator. Eventually, the rate constants of the
TRP kinetic module [C], the PEP consumption stoichiometry,
and the rate-constants of the all modules [A], and [B] were
re-estimated (refined) with using the whole (complete) hybrid
HSMDM {cell + FBR} dynamic model by using the all available
experimental kinetic trajectories of the key-species offered by
Chen [62] (see the acknowledgement of Maria [60]), and given
in (Figures 7,9-11).
c) The initial guess of the rate constants of the TRP module [C]
were adopted from the literature [60]. Finally, this rough estimate
was refined with using the experimentally recorded TRP
species dynamic trajectory. The required PEP, and GLC dynamic
trajectories were transferred from the concomitantly simulated
{FBR, module [A], and module [B]} dynamic models, all
being available at this point.
d) By contrast to the literature, in the TRP balance of (Table 3),
an activation-inhibition term was considered by bringing together
the substrate (PEP), and the first key-enzyme (anthranilate
synthase, E) who trigger the TRP synthesis [60]. Such an
approach was proved to better fit the experimental data , Ctrp
(tu), u = 1,...,n (no. of data, i.e. 17) of (Figure 11), and to confer
more flexibility/adjustability to the kinetic model. The estimated
negative ’g’ constant, of a small negative value, reflects
the slightly inhibition of the TRP-synthesis with the substrate
PEP, as suggested in the literature” [60].
The FBR dynamic model
”All the above described four cell kinetic model modules {[A],
[B], [C], and [X]} are integrated in the FBR dynamic model, thus resulting
the complete HSMDM model. To not complicate the numerical
simulations, the FBR model adopted by Maria [60] is a classical
one, that is the FBR ideal model of Moser [80], which fairly describe
the key-species dynamics during the batch at a macroscopic level
(in the liquid bulk phase). The bioreactor initial conditions and the
time step-wise dynamics of the two control variables [that is
a. the concentration of the added GLC substrate solution, and
b. the feed flow-rate will be further explored to derive a desired
optimum operation policy of the studied FBR of (Table 1)].
The bioreactor ideal model main hypotheses are the followings
[80]:
a) Isothermal, iso-ph, iso-DO operation;
b) It is self-understood that nutrients, additives, antibiotics, and
ph-control compounds are added initially and during FBR operation
to ensure the optimal grow of the biomass, as indicated
by Chen [62];
c) Oxygenation (with pure oxygen) in excess over the batch to ensure
an optimal biomass maintenance, and to contribute to the
liquid homogeneity;
d) Perfectly mixed liquid phase (with no concentration gradients),
of a volume increasing according to the liquid feed flowrate
time-varying policy;
e) The limits of the liquid feed flow-rate FL,j (in Table 2B) are
adjusted to not to exceed the bioreactor capacity Max (VL”) in
(Table 1);
f) Negligible mass resistance to the transport of oxygen and compounds
into the liquid and biomass flocks (if any);
g) GLC-substrate is initially added in the bioreactor and during
the batch with a concentration cfeedglc,j according to an optimal
feeding policy to be determined for every time-arc index ’j’ in
the (Table 2B);
h) The feed flow-rate during the batch FL,j is varied according to
an optimal feeding policy to be determined for every time-arc
index ’j’ in the (Table 2B).
The HSMDM dynamic model is hybrid (bi-level) because it connects
the macro-state variable of the FBR (biomass X, GLC, TRP,
PYR) with the cell nano-scale key-variables (GLC, F6P, FDP, PEP,
PYR, ATP, in Table 2B, and Table 4) of the glycolysis, and of the ATP
recovery system, and those (TRP, OR, OT, MRNA) of the TRP operon
expression (Table 3). The all four kinetic modules are linked to the
macroscopic FBR dynamic model through the formulated mass bal
ances in (Table 2B, Table 4, and Table 3). From a mathematical point
of view, in a general form, the HSMDM dynamic hybrid model of
{cell + FBR} in (Table 2B, Table 4, and Table 3) translates to a set of
12 differential mass balances (ODE set) written for the key-species
of the FBR in the following form [30,60]:
a) Species in the bulk-phase (macro-scale), that is the (dc(i)/
dt) of (Table 2B), where ’i’ denotes species present in the FBR
bulk. These refer to: GLC denoted as cegxlct/dt , and biomass X
denoted as (d CX /dt)]. Here, ’j’ denotes the FBR feeding timearcs;
j = 1,..., Ndiv , with an adopted Ndiv = 5 here.
b) Key-species inside cells (nano-scale), that is the (dc(i)/dt) of
(Table 2B), where ’i’ denotes the following species inside cells:
(GLC, F6P, FDP, PEP, PYR, ATP) for the glycolysis of (Table 2B,
and (Table 4), and (OR, MRNA, E, TRP) for the TRP-operon expression
(Table 3).
c) The biomass in the bulk phase, that is the (dcx/dt) of (Table
2B).
d) The liquid volume dynamics, that is the (dVL/dt) of (Table 2B).
In the GLC mass balance of (Table 2B),cfeedglc,j refers to the concentration of GLC in the feeding solution, constant over the time-interval ’j’ (j = 1, Ndiv,). In the present case only GLC is fed in the FBR during the batch. The reaction rate expressions together with the associated rate constants of the V1-V6 fluxes and other details are given in (Table 4, and Table 3). For the TRP-operon expression, the reaction rate expressions together with the associated rate constants are given in (Table 3). In the (Table 2B, and Table 3), c = vector of species concentrations; Co = initial value of c (at time t=0) given in (Table 1); k = vector of the model rate constants. The reactor content dilution (determined by the increasing VL in its mass balance of Table 2B is due to the continuously added FL,j. In the HSMDM dynamic hybrid model of (Table 2B, and Table 3), the variables GLC and FL are the control ones. The optimal FL,j and cfeedglc,j to be determined are given on time step-wise values over j =1,…, Ndiv time-arcs (with an adopted Ndiv = 5 here). For this adopted Ndiv = 5, the j =1,…, Ndiv time-arcs switching points given in the (Table 2B) are the followings: T1= tf/Ndiv (12.5 h); T2= 2´tf/Ndiv (25 h); T3= 3´tf/Ndiv (37.5 h); T4= 4´tf/Ndiv (50 h) ; where tf = 63 h. More specifically, the validity time-intervals of FL,j and , cfeedglc,j to be determined are given in (Table 2B).
To not complicate the engineering calculus, the main assumption in the time step-wise feeding policy of FL, [GLC]feed in (Table 2B) is that on each time step-wise ’arc’, index j =1,…,Ndiv, the control variables FL,j and cfeedglc,j . are kept constant. Of course, the values on each time-arc do not have to be necessarily equal to each other.
The ’nominal’ FBR not-optimal operating conditions. Under these conditions of Chen [62], the control variables FL,j and , cfeedglc,j are kept constant on each time-arc index “j” at the ad-hoc non-optimal values given in (Table 1). Moreover, they are also equal between

FBR optimal operating conditions”.
By contrast, under the optimal operating conditions of the FBR studied in this section 3, the suitable time step-wise FL,0-FL,4, and those of cfeedglc,0-cfeedglc,4 are to be determined together (simultaneously) to reach the optimum of an objective function (that is the maximum of TRP production here).” Multi-objective FBR optimization is also possible (see [8,26,175]), but is beyond the scope of this research.
Apart from an optimal operating policy, the TRP production
in the FBR can be intensified by using GMO routes discussed
by [4,5,60]. Thus, as revealed by the concerned literature [43-
46,60,62,63,66], intensifying the TRP synthesis strongly depends
on a couple of internal/external factors, as followings:
a) The glycolysis intensity (mainly, the GLC uptake flux, and the
average levels of glycolytic species), transmitted via TRP to the
module [C] via the shared PEP intermediate;
b) The glycolysis dynamics (QSS, or oscillatory behaviour). On the
other hand, as pointed-out by Maria [43,44,46,66], in turn, the
glycolysis intensity is controlled by several cell internal and external
factors, as reviewed by Maria [4,5,42,43,44,46,60].
Rate constants estimation for the HSMDM hybrid model
In short, “the methodology used by Maria [60] to estimate the above built-up HSMDM hybrid bi-level modular dynamic model consists in a sequence of a trial-and-error steps, by adjusting the literature information (reaction rate expressions and constants characterizing the dynamics of cell metabolic species of interest) to fit the available experimental kinetic data recorded from the above described FBR in (Table 1) and section 3.4. The sequence of computational steps is described in detail by Maria [60]. In total, the developed HSMDM hybrid structured kinetic model includes 49 rate constants to be estimated from the experimental kinetic curves of 4 observed species (GLC, TRP, PYR, X), each species time-trajectory including 17 uniformly distributed recorded points (Figures 7,9- 11). This estimation problem is equivalent to a nonlinear programming one (NLP) of high difficulty [86] due to its high dimension, and high non-linearity of the dynamic model and their constraints.
To avoid unfeasible local estimates of the NLP problem, Maria [60] used a sequential approach. A rough estimate of the kinetic rate constants for the modules [A+B+C+X] given in (Tables 2B, Tables 4, Tables 3) was generated by using a step-by-step (module- after-module) approach, with also accounting for the shared species {PEP by modules [A+C]; X, and GLC for modules [A+B+X]}. If missing during simulations, the experimental TRP, GLC, or X time-trajectories were taken instead (interpolated with the cubic splines INTERP1 facility of MatlabTM package [60]). Finally, the thus obtained rate-constants were refined by means of a standard weighted least square criterion [86] with considering the whole FBR hybrid HSMDM model, with including the all 4 inter-connected modules [A+B+C+X]. To reduce the problem size, only 27 independent model rate constants were accounted during estimation (from the total of 49 rate constants). A number of (49-27) rate constants have been adopted from the literature [30,44-46,60]. Eventually, the all 49 rate constants have been refined by Maria [60], and pre, ,1 ,2 ,3 ,4 sented in (Tables 2B,3,4). The thus identified FBR hybrid structured dynamic model fit very well the experimental data as indicated by the comparative plots of (Figures 7-11).
As a parenthesis, the multi-modal NLP estimation problem (see below) solved by Maria [60] is a difficult one, being highly nonlinear, with including nonlinear constraints defining a non-convex domain. For such large-size non-convex estimation problems, the commercial optimization routines usually encounter difficulties in reaching the feasible global solution with an acceptable reliability. This is why, a very effective NLP solver has been used instead, that is the adaptive random search MMA of Maria [114,115] implemented on the MatlabTM numerical calculus platform by Maria [115]. The NLP solution was checked by using several (randomly generated) initial guesses for the rate-constants. A stiff integrator (ODE15S routine of MatlabTM package) has been used to solve the ODE dynamic model with a high accuracy.
A comparison of the model estimated rate constants for the GMO T5 E. coli strain from using the FBR experimental data of Chen [62], with those of the same model but estimated for experiments using the ’wild’ E. coli strain was presented by Maria [60]. As expected, most of the estimated rate constants present similar values for some CCM-core reaction steps. However, due to the mentioned modified GLC import system of the used E. coli T5 strain in the final HSMDM kinetic model, important differences between the two strains of this bacteria are reported for: a) The rate expression and parameters of the GLC import system (that is flux V1 in Table 2-A vs. Table 2B, and Table 4); b) The biomass growing dynamics (Table 2B), and c) The TRP-synthesis module [C], in both parameters and rate expressions (Table 3 vs. the TRP-operon expression model of [44,60]).
As another observation, for the nominal (not-optimal) FBR experimental conditions (Table 1) used by Chen [62], the species dynamics belonging to inside the cell, and to the external liquid-phase tend to reach a quasi-steady-state (QSS) that corresponds to a balanced cell growth (homeostasis) in the bioreactor. This is not always the case for a FBR with a variable feeding in both flow-rate and GLC concentration.”
The fed-batch bioreactor (FBR) optimization problem
As proved in this section 3 (for the case study no. 2), the above
described HSMDM realizes a higher prediction detailing degree, by
characterizing the dynamics of [11(cell species) + 4(bulk species)]
vs. only [3 (bulk species – GLC, TRP, X)] by a classical macroscopic
FBR model (with a Monod kinetics, not presented here), while covering
a wider range of control variables, and various GMO E. coli
cells strains. The used HSMDM presents also many others advantages,
such as [4,5]:
a) Complex HSMDM-s can be used for bioinformatics purposes,
by evaluating the influence of the bioreactor operating conditions
(that is the control macro-variables) on the dynamics of
cell nano-scale key-intermediates and fluxes involved in the
metabolite synthesis of interest (that is, those belonging to
glycolysis, ATP-recovery system, and TRP-operon expression),
thus directing the design of genetically modified cells with desirable
‘motifs’ [60,62].
b) To better understand the cellular bioprocess in direct connection
to the bioreactor operating mode. For instance, it can
in-silico be determined the conditions of occurrence of oscillations
for the glycolysis [43,46,66], or oscillations in the TRP-operon
expression [43,44,60], or those leading to a balanced cell
growth (quasi-steady-state QSS, i.e. homeostasis) [43-47].
The optimal FBR operation for this case study is more complex
than the simple non-optimal (’nominal’) operation of Chen [62]
from (Table 1). Mainly, the feed flow-rate and GLC concentration in
the feeding solution are no longer kept constant. By contrast,
a) the batch-time is divided in Ndiv (equal time-’arcs’) of equal
lengths, and
b) the control variables are kept constant only over every ’timearc’
at optimal values for each time-arc determined from solving
an optimization problem (i.e. maximization of the TRP production
in this case).
The time-intervals of equal lengths Δt = tf /Ndiv are obtained by dividing the batch time tf into Ndiv parts tj-1 ≤ t ≤ tj , where tj = jΔt are switching points (where the reactor input is continuous and differentiable). Time-intervals for the present case study with an adopted Ndiv = 5 are shown in the ’Liquid volume dynamics’ (ix) row of (Table 2B), and in its Footnote (a).”
Selection of the FBR control variables
By analysing the FBR hybrid model of (Table 2B),”completed by the reaction rates expressions and parameters given in the (Table 4, and Table 3), the natural option is to choose as control variables those with the higher influence on the biological process, and easily to handle. In the present case, according to the discussion concerning the FBR dynamic model (chap. 3.5.5), two control variables were chosen, namely those related to the reactor feeding, that is: a.)- The GLC substrate cfeedglc,j (j = 1,…, Ndiv) whose concentration in the FBR play the major role in the cell glycolysis efficiency and TRP production; b.)- The liquid feed flow-rate FL,j (j=1,…, Ndiv) with GLC solution who is directly linked to the GLC feeding, and responsible for the reactor content dilution (the dilution rate being defined as D = FL/VL ).
In the present optimization strategy, each control variable is kept constant over each time-arc (index ’j’) of the batch. Of course, they are not necessarily equal between different time-arcs. For Ndiv = 5, in total there are 5 ´ 2 = 10 unknown eqn. (1) to be determined by optimization, under certain constraints, that is (Table 6-2)”:

The FBR initial state is given in (Table 1) for both inside cell, and bulk-phase species. Those of the FBR control, and the bulkphase variables, that is, the initial liquid flow rate, and the substrate initial concentration [as shown in Table 2B, in the line of “(ix) the feeding policy”, and of “GLC feeding policy (Footnote a)”] are included as unknown variables in the FBR optimization, that is:

FBR optimization - objective function (Ω) choice
By considering the control variables indicated in eqn. (1), the FBR optimization consists of determining its optimal initial load, simultaneously with its feeding policy for every time-interval during the batch eventually leading to maximization of [TRP] production during the batch, that is:
Find the control variables values of eqn. (1-3), to reach

The [TRP](t) dynamics in eqn. (4) is evaluated by solving the ODE HSMDM dynamic model of the FBR (the linked Table 2B, Table 3, and Table 4] over the whole batch time (t)∈[0, tf ]).”
Optimization problem constraints
The optimization problem eq. (4) is “subjected to the following
multiple constraints:
(a).- The FBR HSMDM model including the bioprocess kinetic
model, that is the linked [Table 2B, Table 3, and Table 4];
(b).- The FBR initial condition from (Table 1), excepting for FL,o
and cfeedglc,0
which are determined from solving the optimization
problem (the initial guess is taken from the same Table 1);
(c).- To limit the excessive consumption of GLC substrate, and
to prevent the hydrodynamic stress due to the limited reactor
volume, feasible searching ranges are imposed to the control/
decision variables, that is:

As an observation, the imposed ranges for the control variables are related to not only the implementation facilities, but also to economic reasons, meaning minimum substrate consumption, reduced dilution of the reactor content, and an effective bioreactor control.
Selecting the number of time-arcs (Ndiv), and of the operating alternative
The adopted FBR operating policy alternative of chap. 3.6.1
(“Selection of the FBR control variables”) is the simplest, and easiest
to be implemented operating mode for the two control variables.
”It implies a time step-wise variable feeding of the bioreactor,
over an adopted equal time-arcs (Ndiv = 5 here) that covers the
whole batch time tf. Each time-arc ’j’ (j = 1,…, Ndiv) is characterized
by optimal levels of the feed flow-rate FL,j, and of the GLC concentration
cfeedglc,j in the feeding solution, eqn.(1-3). This type of FBR
operation, despite its simplicity and easy to be implemented, it still
includes enough degrees of freedom to offer a wide range of FBR
operating facilities that, in principle, might be investigated, for instance
(see also the discussion of Maria [7]):
a) By choosing unequal time-arcs, of lengths to be determined by
the optimization rule;
b) By considering the whole batch time as an optimization variable;
c) By increasing the number of equal time-arcs (Ndiv) to obtain
a more refined and versatile FBR operating policy, but keeping
the same non-uniform feeding policy (that is of the two control
variables), as adopted here.
d) By considering the search min/max limits of the control variables
as unknown (to be determined).
e) By feeding the bioreactor with a variable feed flow-rate, but
with a glc solution of an uniform concentration over a small/
large number (Ndiv) of time-arcs.
Most of these alternatives are not feasible, by presenting a large
number of disadvantages, as extensively discussed by [7,30]. The
optimization alternative used in this section is the best, because:
a) Is simple, by accounting only two control variables (chap.
3.6.1-“ selection of the fbr control variables”),
b) It accounts a relatively small number of time arcs, that is Ndiv
= 5, with equal time-arc-lengths of tf /(Ndiv) = 63/5 h.
The alternatives (a-e) are not approached here from the following reasons:
a) Alternatives (a-c) are not good options, because as (Ndiv) increases, the necessary computational effort grows significantly (due to considerable increase in the number of searching variables), thus hindering the quick (real-time) implementation of the derived FBR operating policy. Additionally, multiple optimal operating policies can exist for the resulted over-parameterised constrained optimization problem of a high non-linearity, thus increasing the difficulty to quickly locate a feasible globally optimal solution of the FBR optimization problem. A brief survey of the FBR optimization literature [165,166] reveals that a small number (Ndiv) < 10 is commonly used for such a FBR operation due to the above-mentioned reasons.
Additionally, as the (Ndiv) increases, the operating policy is more difficult to implement, since the optimal feeding policy requires a larger number of stocks with feeding substrate solutions of different concentrations, separately prepared to be fed for every time-arc of the FBR operation (a too expensive alternative). Also, the NLP optimization problem is more difficult to solve because of the multi-modal objective function, leading to multiple solutions difficult to discriminate and evaluate. This is the case, for instance of an obtained infeasible optimal policy requiring a very high [X], difficult to be ensured due to limitations in keeping necessary levels of the related running parameters of the bioreactor (that is dissolved oxygen, nutrients, pH-control substances, anti-bodies, etc.). Besides, FBR operation with using a larger number of small timearcs (Ndiv) can raise special operating problems when including PAT (Process Analytical Technology) tools [167].
b) The alternative (d) is unlikely because it might indicate unrealistic
results, as explained at the point (c) of chap. 3.6.3 (“Optimization
problem constraints”). In our numerical analysis,
carefully documented upper bounds of control variables were
tested to ensure the practical implementation of the optimal
operating policy.
c) The alternative (e) is also not feasible, even if a larger (Ndiv)
will be used. That is because, it is well-known that the variability
of the FBR feeding over the batch time-arcs is the main
degree-of-freedom used to obtain optimal operating policies of
superior quality” [7,26,30,60,168]. By giving up to the variable
feed flow-rate and substrate concentration, sub-optimally FBR
operating policies will be obtained, of low performances.
The used numerical solvers
The time-evolution of the accounted species (index “j”) in the HSMDM model (those from inside cell, and those from the bulkphase) governed by the mass balances [ (dc(j)/dt) in (Table 2B), and in the section 3.5.5. “the FBR dynamic model”] is obtained by solving the FBR HSMDM dynamic model of (connected Table 2B, Table 3, and Table 4) with the initial condition of Cj,0 = Cj (t=0) of (Table 1) for the inside cell species, except bulk [GLC]0 to be determined from the FBR optimization, as indicated by eqn. (1-3). The imposed batch time tf , and the optimal medium conditions are those of (Table 1). The dynamic model solution was obtained with a high precision, by using the high-order stiff integrator (’ode15s’) of the MATLAB™ computational platform, with suitable routine parameters to keep the integration error very low. Because of the particular math form of the FBR HSMDM model, the optimization objective eqn. (4), and the “problem constraints” eqn.(5-8) (chap. 3.6.3) are all highly nonlinear, the formulated optimization problem eqn.(1-4) translates into a nonlinear optimization problem (NLP) with a multi-modal objective function and a non-convex searching domain. To obtain the global feasible problem solution with enough precision, the multi-modal optimization solver MMA of Maria [86,114,115] has been used, as being proved in previous works to be more effective compared to the common (commercial) algorithms. The computational time was reasonably short (minutes- hours) using a common PC, thus offering a reasonable quick implementation of the obtained FBR optimal operating policy.
Optimization results and discussion
The obtained optimal operating policy of the FBR, derived from solving the optimization problem formulated in the chap. 3.6.2 (“FBR optimization - objective function choice”), with the control variables defined in the chap. 3.6.1 (“Selection of the FBR control variables”), and the constraints defined in chap. 3.6.3 (“Optimization problem constraints”), and with the adopted Ndiv in chap. 3.6.4 (“Selecting the number of time-arcs Ndiv, and of the operating alternative”) is given in (Figure 9) for the feeding policy of the GLC concentration cfeedglc,j (j = 1,…,5), and in (Figure 10-a) for the feed flow-rate FL,j (j = 1,…,5). ”It is to observe that, due to the above formulated engineering problem, the FBR optimal operating policy will be given for every of time-intervals (of equal lengths) uniformly distributed throughout the batch-time. Such an optimal time stepwise variable feeding of the bioreactor presents advantages and inherent disadvantages. The advantages are related to the higher flexibility of the FBR operation, leading to a higher productivity in TRP as proved in this section. Beside, the imposed limits of the control variables prevent excessive substrate consumption with any benefit, or an excessive reactor content dilution.
As a disadvantage, the FBR-s with such a time-variable control are more difficult to operate than the simple batch bioreactor (BR), as long as the time step-wise optimal feeding policy requires a-priori prepared Ndiv stocks of feeding substrate solutions of different concentrations to be used over the batch. This is the price paid for achieving FBR best performances. This need to previously prepare different substrate stocks to be fed for every ’time-arc’ (that is a batch-time division in which the feeding is constant) is offset by the net higher productivity of FBR compared to those of a simple BR as below discussed, and pointed-out in the literature [8,24,26,166,169,175]. In fact, the best operating alternative (FBR vs. BR) is related to many others economic factors (operating policy implementation costs, product cost compared to its production costs, product price fluctuation, etc.), not discussed here.”
The obtained optimization problem solution with above discussed
particularities is given in (Figure 9-top, curve 2) for the
GLC feeding concentrations, and in (Figure 10-a, curve 2) for the
feed flow-rate (FL). Thus optimally operated FBR displays the bulk
[TRP] dynamics of (Figure 11, curve 2). The corresponding dynamics
of cell glycolytic species during the batch is presented in
(Figure 7), while those belonging to the TRP-operon expression in
(Figure 8). The dynamics of species present in the reactor liquid
phase IS presented in (Figure 9) for GLC, and in (Figure 10-c) for
the biomass (X). In these figures, the species dynamics plotted for
the optimal FBR operation (black curves 2, i.e. the HSMDM model
predictions) are compared to those corresponding to the nominal,
non-optimal FBR operation (blue curve 1 of Maria [60]), and with
the experimental blue points of Chen [62]. The both operating policies
(optimal 1, and the non-optimal 2) are obtained with using the
same modified E. coli T5 strain of Chen et al. [62,63].” By analysing
the resulted FBR optimal operating policy (plots no. 2 in Figures
7-11) compared to those of the sub-optimal (nominal) operation of
Chen [62], several conclusions can be derived, as followings:
a) By using the same FBR even if operated under the nominal
(non-optimal) conditions of (Table 1), the modified E. coli T5
strain reported a higher GLC-uptake rate, and a TRP-production
much higher (with ca. 50%, [63]) compared to the “wild”
strain, as revealed by the comparative analysis given in (Table
5).
b) The efficiency of the optimally operated FBR (this paper) in
the TRP-production is significantly higher (with ca. 20%) compared
to the same FBR but sub-optimally (nominally) operated
(Table 5), even if the same modified E. coli T5 strain was
employed in both cases. The same conclusion also results by
comparing the TRP final concentrations in the FBR bulk given
in (Figures 9-11) for the two operating policies (optimal-variable
feeding vs. non-optimal/uniform fed). If one add to this
20% production increase due to the optimally operated FBR,
to the 50% due to the use of the GMO bacteria, it results a total
of 70% increase in the TRP production compared to the ”wild”
strain used in the same FBR.
c) The optimal FBR operation reported a similar dilution of the
reactor content, as revealed by (Figure 10-b) for the two operating
alternatives of the FBR (optimal, and non-optimal). By
contrast, the substrate GLC is better used, as proved by (Table
5). The GLC consumption in (Table 5) was computed with the
following:

d) As expected, a higher TRP-productivity requires a higher GLC consumption, as the case when using a modified E. coli T5 strain instead the “wild” type. As revealed by (Table 5), the GLC consumption is influenced by the FBR operating mode, even if the same cell strain is used. As indicated by our present analysis given in (Table 5), the GLC overall consumption for the optimal (variable feeding) FBR operation is roughly similar to that of a non-optimally (uniform feeding) FBR operation. Not surprisingly, the optimal operating mode requires a slightly lower GLC consumption (with ca. 6%). That is because its better use during the batch.
Table 5:Efficiency of the modified E.coli T5 strain for GLC-uptake, and for the TRP production in the tested FBR of (Table 1). Adapted from Maria and Renea [30].
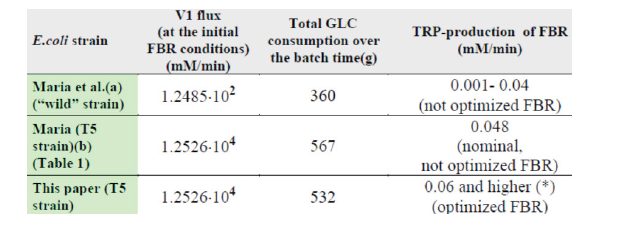
e) The comparative analysis of the glycolytic species dynamics in
(Figure 7) reveals close trajectories (even quasi-identical for
F6P, FDP species), with any accumulation tendency, for both
nominal (not-optimal, curves 1), or optimal (curves 2) FBR operation.
By contrast, the intermediate PEP intermediate species
is formed in high amounts but then is quickly consumed
in the subsequent TRP synthesis, thus tending to reach a QSS.
The more intensive GLC import for the optimal FBR operation
(curve 2) and its successive transformation over the glycolysis
pathway, and TRP-operon expression is reflected by a higher
ATP consumption compared to the non-optimal FBR operation.
The PYR metabolite is consumed in the TCA cycle, and
excreted in the bulk-phase (fairly predicted by our HSMDM kinetic
model in Figure 7, thus matching the experimental data).
f) The comparative analysis of the TRP-operon expression species
dynamics in (Figure 8) reveals very close trajectories between
the two alternative FBR operation. The exception is the
excreted TRP, which displays a different dynamics for the nominal
(not-optimal, curves 1), or optimal (curves 2) FBR operation.
Such a result can be explained by the operon expression
mechanism, involving a tight control via its inhibition terms
presented in (Table 3).
g) The comparative plots of GLC concentration dynamics in the
FBR bulk-phase are presented in (Figure 9). They indicate
similar decreasing trajectories for the both investigated FBR
operating alternatives: i) nominal (not-optimal, curves 1), or
optimal (curves 2). Such a result can be explained by the same
GLC-uptake mechanism of the modified E. coli T5 strain. In the
optimal case (curves 2) the GLC consumption is higher, due to
a higher TRP productivity. The curve 2 unevenness is linked to
the variable feeding with GLC of the optimally operated FBR
[see the feeding plots in the top part of (Figure 9)].
h) The comparative plots of the biomass dynamics in the FBR
bulk-phase are presented in (Figure 10-c). They reveal similar
increasing trajectories, for the both investigated FBR operating
alternatives: i) nominal (not-optimal, curves 1), or optimal
(curves 2). In the optimal operation case the biomass growth
is more intense (reaching a 10% in the bioreactor, close to the
admissible limit [170,171]), due to a significant higher GLC-uptake,
and a better GLC use during the batch, thus offering more
favourable biomass growth conditions.
i) The TRP concentration dynamics in the bulk-phase is plotted
in (Figure 11) for the both investigated FBR operating alternatives:
a) Nominal not-optimal operation of (Table 1), that is curves 1,
compared to the experimental data (•, blue) of Chen [62], or
b) Optimal FBR operation (curve 2).
The TRP higher final concentration leads to a higher productivity for the optimally operated FBR (see above observation no. 2). Such a result proves that the optimal time stepwise FBR feeding [that is, the GLC feeding curve 2 in Figure 9-top), and the feed flow-rate policy of Figure 10-a] is superior to the non-optimal uniform feeding of the bioreactor, leading to a better GLC use, even if, the overall GLC consumption [see the above observation no. 4] is similar for both nominal, and optimal FBR operation. The better GLC use for the optimal FBR operation is also proved by the less produced secondary metabolite PYR in (Figure 7, curve 2), and by a smaller QSS concentration for the PEP intermediate (Figure 7, curve 2), quickly transformed in the final product TRP.
References
- Maria G (2017A) A review of some novel concepts applied to modular modelling of genetic regulatory circuits. Juniper publ, Irvine, CA, USA.
- Maria G (2017B) Deterministic modelling approach of metabolic processes in living cells - a still powerful tool for representing the metabolic process dynamics. Juniper publ, Irvine, CA, USA.
- Maria G (2017C) Application of (bio) chemical engineering principles and lumping analysis in modelling the living systems. Current Trends in Biomedical Engineering & Biosciences 1(4): 555566-555570.
- Maria G (2018) In-silico design of Genetic Modified Micro-organisms (GMO) of industrial use, by using Systems Biology and (Bio)Chemical Engineering tools. Juniper publ, Irvine, CA, USA.
- Maria G (2023) Hybrid modular kinetic models linking cell-scale structured CCM reaction pathways to bioreactor macro-scale state variables. Applications for solving bioengineering problems. (In-press galley-proofs), Juniper publ. Irvine, CA, USA.
- Liese A, Seelbach K, Wandrey C (2006) Industrial biotransformations, Wiley-VCH, Weinheim, 2006.
- Maria G (2020A) Model-based optimization of a fed-batch bioreactor for mAb production using a hybridoma cell culture. Molecules-Basel-Organic Chemistry 25(23): 5648-5674.
- Scoban AG, Maria G (2016) Model-based optimization of the feeding policy of a fluidized bed bioreactor for mercury uptake by immobilized P. putida cells. Asia-Pacific Journal of Chemical Engineering 11(5): 721-734.
- Ghose TK, Fiechter A, Blakebrough N (1977-1978) Advances in Biochemical Engineering. Springer Verlag, Berlin vol. 7-10.
- Straathof AJJ, Adlercreutz P (2005) Applied biocatalysis. Harwood Academic Publ, Amsterdam.
- Jiménez González C, Woodley JM, (2010) Bioprocesses: modeling needs for process evaluation and sustainability assessment. Comput Chem Eng 34(7): 1009-1017.
- Khamseh AAG, Miccio M (2012) Comparison of batch: fed-batch and continuouswell-mixed reactors for enzymatic hydrolysis of orange peel wastes. Process. Biochem 47(11): 1588-1594.
- Tsangaris DM, Baltzis BC (1996) Evaluation of batch and semi-batch reactor operation for enzymatic reactions with inhibitory kinetics. Chemical Engineering Science 51(11): 2757-2762.
- Nedovic V, Willaert R (2005) Applications of cell immobilisation technology. Springer verlag, Amsterdam.
- Mara C (2019) Studies on industrial reactor optimization involving complex multi-enzymatic systems. PhD thesis, Univ Politehnica of Bucharest.
- Górecka E, Jastrzębska, M (2011) Immobilization techniques and biopolymer carriers. Biotechnol Food Sci 75 (1): 65-86.
- Basso A, Serban S (2020) Overview of Immobilized Enzymes’ Applications in Pharmaceutical, Chemical, and Food Industry. Guisan J, Bolivar J, López Gallego F, Rocha Martín J (eds), Immobilization of Enzymes and Cells. Methods in Molecular Biology, Humana, New York vol. 2100.
- Buchholz K, Hempel DC (2006) From gene to product (Editorial), Eng Life Sci 6(1): 437-437.
- Hempel DC (2006) Development of biotechnological processes by integrating genetic and engineering methods. Eng Life Sci 6(5): 443-447.
- Maria G, Gijiu CL, Crişan M, Maria C, Tociu C (2019) Model-based re-design of some genetic regulatory circuits to get Genetic Modified Micro-organisms (GMO) by using engineering computational tools (a mini-review), Current Trends in Biomedical Engineering & Biosciences 18(3): 555988-555995.
- Maria G, Maria C, Tociu C (2018F) A comparison between two approaches used for deterministic modelling of metabolic processes and of genetic regulatory circuits in living cells. UPB Sci Bull, Series B - Chemie 80(1): 127-144.
- Maria G, Scoban AG (2017) Setting some milestones when modelling gene expression regulatory circuits under variable-volume whole-cell modelling framework. 1. Generalities. Revista de Chimie (Bucharest) 68(12): 3027-3037.
- Maria G, Scoban AG (2018) Setting some milestones when modelling gene expression regulatory circuits under variable-volume whole-cell modelling framework. 2. Revista de Chimie (Bucharest) 69(1): 259-266.
- Maria G (2012) Enzymatic reactor selection and derivation of the optimal operation policy, by using a model-based modular simulation platform. Comput Chem Eng 36(1): 325-341.
- Maria G, Crisan M (2014) Evaluation of optimal operation alternatives of reactors used for D-glucose oxidation in a bi-enzymatic system with a complex deactivation kinetics. Asia-Pacific Journal of Chemical Engineering 10(1): 22-44.
- Maria G, Crisan M (2017) Operation of a mechanically agitated semi-continuous multi-enzymatic reactor by using the Pareto-optimal multiple front method. J. Process Control 53(1): 95-105.
- Maria G (2020B) Model-based optimization of a batch reactor with a coupled bi-enzymatic process for mannitol production. Computers & Chemical Engineering 133(2): 106628-106635.
- Maria G, Peptănaru IM (2021) Model-based optimization of mannitol production by using a sequence of batch reactors for a coupled bi-enzymatic process – A dynamic approach, Dynamics-Basel MDPI 1(1): 134-154.
- Maria G, Renea L, Maria C (2022) Multi-objective optimization of the fed-batch bi-enzymatic reactor for mannitol production. Dynamics 2(3): 270-294.
- Maria G, Renea L (2021) Tryptophan production maximization in a fed-batch bioreactor with modified coli cells, by optimizing its operating policy based on an extended structured cell kinetic model, Bioengineering 8(12): 210-247.
- DiBiasio D (1989) Introduction to the control of biological reactors. In: Shuler, M.L. (ed.), Chemical engineering problems in biotechnology. American Institute of Chemical Engineers, New York pp. 351-391.
- Hatzimanikatis V, Floudas CA, Bailey JE (1996) Analysis and design of metabolic reaction networks via mixed‐integer linear optimization. AIChE Jl 42(5): 1277-1292.
- Maria G (2014B) Extended repression mechanisms in modelling bistable genetic switches of adjustable characteristics within a variable cell volume modelling framework. Chemical & Biochemical Engineering Quarterly 28(1): 35-51.
- Maria G (2009) Building-up lumped models for a bistable genetic regulatory circuit under whole-cell modelling framework. Asia-Pacific Journal of Chemical Engineering 4(1): 916-928.
- Maria G (2006) Application of lumping analysis in modelling the living systems -A trade-off between simplicity and model quality. Chemical and Biochemical Engineering Quarterly 20(1): 353-373.
- Maria G (2007) Modelling bistable genetic regulatory circuits under variable volume framework. Chemical and Biochemical Engineering Quarterly 21(4): 417-434.
- Maria G (2009B) A whole-cell model to simulate the mercuric ion reduction by coli under stationary and perturbed conditions. Chemical and Biochemical Engineering Quarterly 23 (3): 323-341.
- Maria G (2010) A dynamic model to simulate the genetic regulatory circuit controlling the mercury ion uptake by coli cells. Revista de Chimie (Bucharest) 61(2): 172-186.
- Maria G, Luta I (2013) Structured cell simulator coupled with a fluidized bed bioreactor model to predict the adaptive mercury uptake by coli cells, Computers & Chemical Engineering 58(1): 98-115.
- Maria G, Luta I, Maria C (2013) Model-based sensitivity analysis of a fluidised-bed bioreactor for mercury uptake by immobilised Pseudomonas putida cells. Chemical Papers 67(11): 1364-1375.
- Maria G, Xu Z, Sun J (2011) Multi-objective MINLP optimization used to identify theoretical gene knockout strategies for coli cell. Chemical & Biochemical Engineering Quarterly 25(4): 403-424.
- Maria G (2014A) Insilico derivation of a reduced kinetic model for stationary or oscillating glycolysis in Escherichia coli Chemical & Biochemical Engineering Quarterly 28(4): 509-529.
- Maria G (2020C) In-silico determination of some conditions leading to glycolytic oscillations and their interference with some other processes in coli cells. Frontiers in Chemistry 8(1): 526679-526693.
- Maria G, Gijiu CL, Maria C, Tociu C (2018A) Interference of the oscillating glycolysis with the oscillating tryptophan synthesis in the coli cells. Computers & Chemical Engineering 108(15-24): 395-407.
- Maria G, Mihalachi M, Gijiu CL (2018D) In silico optimization of a bioreactor with an coli culture for tryptophan production by using a structured model coupling the oscillating glycolysis and tryptophan synthesis. Chemical Eng Res and Design 135(15-24): 207-221.
- Maria G, Mihalachi M, Gijiu CL (2018B) Model-based identification of some conditions leading to glycolytic oscillations in coli cells. Chemical and Biochemical Engineering Quarterly 32(4): 523-533.
- Maria G, Mihalachi M, Gijiu CL (2018E) Chemical engineering tools applied to simulate some conditions producing glycolytic oscillations in coli cells. U.P.B. Sci. Bull, Series B - Chemie 80(2): 27-38.
- Atkinson MR, Savageau MA, Myers JT, Ninfa AJ (2003) Development of genetic circuitry exhibiting toggle switch or oscillatory behavior in Escherichia coli. Cell 113(5): 597-607.
- Guantes R, Poyatos JF (2006) Dynamical principles of two-component genetic oscillators. PLoS Computational Biology 2(3): e30-e35.
- Elowitz MB, Leibler S (2000) A synthetic oscillatory network of transcriptional regulators. Nature 403(6767): 335-338.
- Gonze D (2010) Coupling oscillations and switches in genetic networks. BioSystems 99(1): 60-69.
- Bier M, Teusink B, Kholodenko BN, Westerhoff HV (1996) Control analysis of glycolytic oscillations. Biophysical Chemistry 62(1-3): 15-24.
- Silva AS, Yunes JA (2006) Conservation of glycolytic oscillations in Saccharomyces cerevisiae. Genetics and Molecular Research 5(3): 525-535.
- Termonia Y, Ross J (1981A) Oscillations and control features in glycolysis: Numerical analysis of a comprehensive model. Proc. National Academy of Sciences of the USA 78(5): 2952-2956.
- Termonia Y, Ross J (1981B) Oscillations and control features in glycolysis: Analysis of resonance effects. Proc. National Academy of Sciences of the USA 78: 3563-3566.
- Termonia Y, Ross J (1982) Entrainment and resonance in glycolysis. Proceedings of the National Academy of Sciences of the USA 79(9): 2878-2881.
- Heinzle E, Dunn IJ, Furukawa K, Tanner RD (1982) Modelling of sustained oscillations observed in continuous culture of Saccharomyces Cerevisiae. Aarne H (Ed.), Proc. Modelling & Control of Biotechnical Process IFAC Conference, Helsinki (Finland) pp. 17-19.
- Tyson JJ (2002) Biochemical Oscillations. Fall CP, Marland ES, Wagner JM, Tyson JJ (Eds.), Computational Cell Biology, Springer verlag, Berlin p. 9.
- Franck UF (1980) Feedback kinetics in physicochemical oscillators. Ber. Bunsenges. Phys. Chem 84(4): 334-341.
- Maria G (2021) A CCM-based modular and hybrid kinetic model to simulate the tryptophan synthesis in a fed-batch bioreactor using modified coli cells. Computers & Chemical Engineering 153: 107450-107466.
- Schmid JW, Mauch K, Reuss M, Gilles ED, Kremling A, et al. (2004) Metabolic design based on a coupled gene expression-metabolic network model of tryptophan production in Escherichia coli. Metabolic Engineering 6(4): 364-377.
- Chen M (2020) Novel approaches for in vivo evolution, screening and characterization of enzymes for metabolic engineering of Escherichia coli as hyper L-tryptophan producer, PhD thesis, TU Hamburg.
- Chen M, Ma C, Chen L, Zeng AP (2021) Integrated laboratory evolution and rational engineering of GalP/Glk-dependent Escherichia coli for higher yield and productivity of L-tryptophan biosynthesis. Metabolic Engineering Communications 12: e00167.
- Bhartiya S, Chaudhary N, Venkatesh KV, Doyle FJ (2006) Multiple feedback loop design in the tryptophan regulatory network of coli suggests a paradigm for robust regulation of processes in series. J R Soc Interface 3(8): 383-391.
- Xiu ZL, Zeng AP, Deckwer WD (1997) Model analysis concerning the effects of growth rate and intracellular tryptophan level on the stability and dynamics of tryptophan biosynthesis in bacteria. Journal of Biotechnology 58(2): 125-140.
- Mihalachi M, Maria G (2019) Influence of PEP glycolytic precursor on tryptophan synthesis dynamics in coli cells. U.P.B. SCI. BULL., SERIES B - CHEMIE 81(2): 29-36.
- Chassagnole C, Noisommit-Rizzi N, Schmid JW, Mauch K, Reuss M, et al. (2002) Dynamic modeling of the central carbon metabolism of Escherichia coli. Biotechnol. Bioeng 79(1): 53-73.
- Maria G, Mihalachi M, Gijiu CL (2018C) Chemical engineering tools applied to simulate some conditions producing glycolytic oscillations in coli cells. U.P.B. Sci. Bull., Series B - Chemie 80(2): 27-38.
- Madsen MF, Dano S, Sorensen PG (2005) On the mechanisms of glycolytic oscillations in yeast. FEBS Journal 272: 2648-2660.
- Wierschem K, Bertram R (2004) Complex bursting in pancreatic islets: a potential glycolytic mechanism. J Theor. Biol 228(4): 513-521.
- Kadir TAA, Mannan AA, Kierzek AM, McFadden J, Shimizu K, et al. (2010) Modeling and simulation of the main metabolism in Escherichia coli and its several single-gene knockout mutants with experimental verification, Microbial Cell Factories 9: 88.
- KEGG (2011) Kyoto encyclopedia of genes and genomes, Kanehisa Laboratories, Bioinformatics Center of Kyoto University.
- Riemer SA, Rex R, Schomburg D (2013) A metabolite-centric view on flux distributions in genome-scale metabolic models, BMC Systems Biology 7: 33.
- Palsson BO (2005) Systems Biology – Properties of reconstructed networks, Cambridge univ. press, Cambridge.
- Stephanopoulos GN, Aristidou AA, Nielsen J (1998) Metabolic Engineering. Principles and Methodologies. Academic Press, San Diego, CA.
- Visser D, Schmid JW, Mauch K, Reuss M, Heijnen JJ, et al. (2004) Optimal re-design of primarymetabolism in Escherichia coli using linlog kinetics. Metabolic Engineering 6(4): 378-390.
- Styczynski MP, Stephanopoulos G (2005) Overview of computational methods for the inference of gene regulatory networks. Comput Chem Eng 29: 519-534.
- Heinemann M, Panke S (2006) Synthetic Biology - putting engineering into biology. Bioinformatics 22(22): 2790-2799.
- Mathews CK, van Holde KE, Ahem KG (1999) Biochemistry, New Jersey, Prentice Hall.
- Moser A (1988) Bioprocess technology - kinetics and reactors, Springer Verlag, Berlin.
- Calhoun KA, Swartz JR (2006) Total amino acid stabilization during cell-free protein synthesis reactions. Journal of Biotechnology 123(2): 193-203.
- Reeves RE, Sols A (1973) Regulation of Escherichia coli phosphofructokinase in situ. Biochemical and Biophysical Research Communications 50(2): 459-466.
- Bennet BD, Elizabeth H Kimball, Melissa Gao, Robin Osterhout, Stephen J Van Dien, et al. (2009) Absolute Metabolite Concentrations and Implied Enzyme Active Site Occupancy in Escherichia coli. Nat Chem Biol 5(8): 593-599.
- Flamholz A, Elad Noor, Arren Bar-Even, Wolfram Liebermeister, Ron Milo, et al. (2013) Glycolytic strategy as a tradeoff between energy yield and protein cost. Proc. Nat. Academy of Science of USA 110(24): 10039-10044.
- Alberton KPE, Andre Luis Alberton, Jimena Andrea Di Maggio, Vanina Gisela Estrada, Maria Soledad Diaz, et al. (2015) Simultaneous parameters identifiability and estimation of an coli metabolic network model, BioMed Res Int article ID= 454765.
- Maria G (2004) A review of algorithms and trends in kinetic model identification for chemical and biochemical systems. Chemical and Biochemical Engineering Quarterly 18: 195-222.
- Maria G (2005) Relations between apparent and intrinsic kinetics of programmable drug release in human plasma. Chemical Engineering Science 60(6): 1709-1723.
- Maria G (2019) Numerical methods to reduce the kinetic models of (bio)chemical processes, Printech Publ., Bucharest p. 815.
- Selkov EE (1968) Self-Oscillations in Glycolysis. 1. A Simple Kinetic Model. European J Biochem 4(1): 79-86.
- Hatzimanikatis V, Bailey JE (1997) Studies on glycolysis- I. Multiple steady states in bacterial. Chemical Eng. Science 52(15): 2579-2588.
- Buchholz A, Hurlebaus J, Wandrey C, Takors R (2002) Metabolomics: quantification of intracellular metabolite dynamics. Biomolecular Eng 19(1): 5-15.
- Westermark PO, Lansner A (2003) A Model of Phosphofructokinase and Glycolytic Oscillations in the Pancreatic b-cell. Biophysical Journal 85: 126-139.
- Degenring D, Froemel C, Dikta G, Takors R J (2004) Sensitivity analysis for the reduction of complex metabolism models. Journal of Proc Control 14(7): 729-745.
- Costa RS, Rocha I, Ferreira EC (2008) Model reduction based on dynamic sensitivity analysis: A systems biology case of study, PhD grant report, University of Minho, Braga (Portugal).
- Costa RS, Machado D, Rocha I, Ferreira EC (2009) Large scale dynamic model reconstruction for the central carbon metabolism of Escherichia coli. Omatu S, et al. (Eds.): Distributed Computing, Artificial Intelligence, Bioinformatics, Soft Computing, and Ambient Assisted Living, Proc. IWANN conf., Salamanca (Spain), June 10-12, 2009, Part II, LNCS 5518, Springer-Verlag, Berlin pp. 1079-1083.
- Costa RS, Machado D, Rocha I, Ferreira EC (2010) Hybrid dynamic modeling of Escherichia coli central metabolic network combining Michaelis–Menten and approximate kinetic equations. BioSystems 100(2): 150-157.
- Peskov K, Mogilevskaya E, Demin O (2012) Kinetic modelling of central carbon metabolism in Escherichia coli. FEBS Journal 279(18): 3374-3385.
- Slominski A, Semak I, Pisarchik A, Sweatman T, Szczesniewski A, et al. (2002) Conversion of L-tryptophan to serotonin and melatonin in human melanoma cells. FEBS Letters 511: 102-106.
- Hernandez-Valdez A, Santillan M, Zeron ES (2010) Cycling expression and cooperative operator interaction in the trp operon of Escherichia coli. Journal of Theoretical Biology 263(3): 340-352.
- Gehrmann E, Christine Glasser, Yaochu Jin, Bernhard Sendhoff, Barbara Drossel, et al. (2011) Robustness of glycolysis in yeast to internal and external noise. Phys Rev 84(2 pt 1): 021913.
- Chandra FA, Buzi G, Doyle JC (2011) Glycolytic oscillations and limits on robust efficiency. Science 333(6039): 187-192.
- Rapp P (1979) An atlas of cellular oscillators. J exp Biol 81: 281-306.
- Diaz Ricci JC (2000) ADP Modulates the Dynamic Behavior of the Glycolytic Pathway of Escherichia coli, Biochemical and Biophysical Research Communications 271(1): 244-249.
- Schaefer U, Boos W, Takors R, Weuster-Botz D (1999) Automated sampling device for monitoring intracellular metabolite dynamics. Analytical Biochemistry 270(1): 88-96.
- Chiarugi D (2006) Feedbacks and oscillations in the virtual cell VICE, Proc. International Conference on Computational Methods in Systems Biology (CMSB), Trento (Italy), Oct. 18-19, pp.93-107.
- Elias A C (2010) Escherichia Coli: Dynamic Analysis of the Glycolytic Pathway, PhD Thesis, Facultad de Bioquímica y Farmacia, Universidad Nacional de Tucumá Argentina.
- de la Fuente I M (2010) Quantitative analysis of cellular metabolic dissipative, self-organized structures. Int J Mol Sci 11(9): 3540-3599.
- Lodish H, Berk A, Zipursky S L, Matsudaira P, Baltimore D and et.al, (2000) Molecular cell biology, W. H. Freeman & Co, New York.
- Yanofsky C (2007) RNA-based regulation of genes of tryptophan synthesis and degradation, in bacteria. RNA 13(8): 1141-54.
- Stephanopoulos G, Simpson T W (1997) Flux amplification in complex metabolic networks. Chem Eng Sci 52(5): 2607-2627.
- Santillan M, Mackey M C (2001) Dynamic behavior in mathematical models of the tryptophan operon. Chaos 11(1): 261-268.
- Maria G (2023B) Comments on several review eBooks promoting a novel kinetic modelling framework of metabolic processes and of genetic regulatory circuits in living cells. Curr Trends in Biomedical Eng & Biosci., (Juniper publ, Irvine CA, USA) 21(2): 556057.
- Olivier B G, Snoep J L (2004) Web-based kinetic modelling using JWS Online. Bioinformatics 20(13): 2143-2144.
- Maria G (2003) ARS combination with an evolutionary algorithm for solving MINLP optimization problems. In Modelling, Identification and Control; Hamza MH (Ed.), IASTED/ACTA Press, Anaheim, CA (USA) pp: 112–118.
- Maria G (1998) Adaptive Random Search and Short-Cut Techniques for Process Model Identification and Monitoring. Proc. FOCAPO98 Int. Conf. on Foundations of Computer Aided Process Operations, July 5-10, 1998, Snowbird (USA), pp: 351-359.
- Maria G, Peptanaru IM (2021) Model-based optimization of mannitol production by using a sequence of batch reactors for a coupled bi-enzymatic process -A dynamic approach, Dynamics-Basel 1: 134-154.
- Moulijn J A, Makkee M, van Diepen A (2001) Chemical process technolog. New York, Wiley, 2001.
- Chaudhuri J, Al-Rubeai M (2005) Bioreactors for Tissue Engineering Design and Operation. Springer Verlag, Berlin, pp: 1-18.
- Bonvin D (1998) Optimal operation of batch reactors-a personal view, J. Process Control 8: 355-368.
- Rao M, Qiu H (1993) Process control engineering: A textbook for chemical, mechanical and electrical engineers, Gordon and Breach Science Publ, Amsterdam.
- Abel O, Marquardt W (2003) Scenario-integrated on-line optimisation of batch reactors, J. Process Control 13(8): 703-715.
- Lee J, Lee KS, Lee JH, Park S (2001) An on-line batch span minimization and quality control strategy for batch and semi-batch processes. Control Eng Pract 9(8): 901-909.
- Ruppen D, Bonvin D, Rippin DWT (1998) Implementation of adaptive optimal operation for a semi-batch reaction system. Comput Chem Eng 22(1-2): 185-199.
- Reuss M (1986) Computer control of bioreactors present limits and challenges for the future. In: Morari M, McAvoy TJ (Eds.), Proc. 3rd Intl. Conf. on Chemical Process Control - CPCIII, Asilomar (USA), Jan. 12-17, 1986. Elsevier, Amsterdam, 1986.
- Banga J R, Alonso A A, Singh P R (1994) Stochastic optimal control of fed-batch bioreactors. AIChE Annual Meeting, San Francisco, Nov. 13-18, 1994.
- Sarkar D, Modak J M (2005) Pareto-optimal solutions for multi-objective optimization of fed-batch bioreactors using nondominated sorting genetic algorithm. Chem Eng Sci 60(2): 481-492.
- Smets IY, Claes JE, November EJ, Bastin GP, van Impe JF (2004) Optimal adaptive control of (bio)chemical reactors. past, present and future, J. Process Control 14(7): 795-805.
- Doran PM (1995) Bioprocess engineering principles, Elsevier, Amsterdam.
- Henson MA (2010) Model-based control of biochemical reactors. Levine W (Ed.). The control handbook, Taylor and Francis (2nd edition), New York.
- Henson MA, Muller D, Reuss M (2004) Combined metabolic and cell population modelling for yeast bioreactor control. Allgöwer F (Ed.). Proc. IFAC Symposium on Advanced Control of Chemical Processes, Hong Kong, pp: 11-14.
- Bodizs L, Titica M, Faria N, Srinivasan B, Dochain D, et.al, (2007) Oxygen control for an industrial pilot-scale fed-batch filamentous fungal fermentation. Journal of Process Control 17(7): 595-606.
- Ashoori A, Moshiri B, Khaki-Sedigh A, Bakhtiari M R (2009) Optimal control of a nonlinear fed-batch fermentation process using model predictive approach. Journal of Process Control 19(7): 1162-1173.
- Agrawal P, Koshy G, Ramseier M (1989) An algorithm for operating a fed-batch fermentator at optimum specific-growth rate, Biotechnol. Bioeng 33(1): 115-125.
- Shuler M L (1989) Chemical engineering problems in biotechnology. American Institute of Chemical Engineers, New York, 1989.
- Maria G (2005B) Modular-Based Modelling of Protein Synthesis Regulation. Chemical and Biochemical Engineering Quarterly 19: 213-233.
- Roeva O, Pencheva T, Tzonkov S, Arndt M, Hitzmann B and et.al, (2007) Multiple model approach to modelling of Escherichia coli fed-batch cultivation extracellular production of bacterial phytase. Journal of Biotechnology 10(4): 592-603.
- Zak DE, Vadigepalli R, Gonye GE, Doyle FJ, Schwaber JS, et.al, (2005) Unconventional systems analysis problems in molecular biology. A case study in gene regulatory network modelling, Comput Chem Eng 29: 547-563.
- Dorka P (2007) Modelling batch and fed-batch mammalian cell cultures for optimizing MAb productivity, MSc diss., University of Waterloo, Canada.
- Edwards J S, Palsson B O (2000) The Escherichia coli MG1655 in silico metabolic genotype. Its definition, characteristics, and capabilities. Proc. Natl. Acad. Sci. USA 97(10): 5528-5533.
- Usuda Y, Nishio Y, Iwatani S, Van Dien S J, Imaizumi A and et.al, (2010) Dynamic modeling of Escherichia coli metabolic and regulatory systems for amino-acid production. Journal of Biotechnology 147(1): 17–30.
- Ceric S, Kurtanjek Z (2006) Model identification, parameter estimation, and dynamic flux analysis of coli central metabolism. Chem. Biochem. Eng. Q 20: 243-253.
- Tusek A J, Kurtanjek Z (2009) Model and global sensitivity analysis of coli central metabolism, In: Troch I, Breitenecker F (Eds.). Proc. 6th Vienna Conference on Mathematical Modelling MATHMOD, Beč, Austria, 11-13 pp.253.
- Teusink B, Passarge J, Reijenga C A, Esgalhado E, van der Weijden C C and et.al, (2000) Can yeast glycolysis be understood in terms of in vitro kinetics of the constituent enzymes? Testing biochemistry, Eur. J. Biochem 267(17): 5313-5329.
- Seressiotis A, Bailey J E (1986) MPS: An algorithm and data base for metabolic pathways synthesis, Biotechnol. Lett 8: 837-842.
- Tomita M, Hashimoto K, Takahashi K, Shimizu T, Matsuzaki Y and et.al, (1999) E-Cell: Software environment for whole cell simulation. Bioinformatics 15(1): 72-84.
- Tomita M (2001) Whole-cell simulation: a grand challenge of the 21st century. Trends in Biotechnology 19(6): 205-210.
- Slepchenko B M, Schaff J C, Macara I, Loew L M (2003) Quantitative cell biology with the Virtual Cell. Trends in Cell Biology 13(11): 570-576.
- Machado D, Zhuang K H, Sonnenschein N, Herrgård M J (2015) Current challenges in modeling cellular metabolism. Frontiers in Bioengineering and Biotechnology 2-3: 4-96.
- Xiong J (2006) Essential bioinformatics, Cambridge University Press, Cambridge (UK).
- Rocha I, Maia P, Evangelista P, Vilaça P, Soares S, et al. (2010) OptFlux: an open-source software platform for in silico metabolic engineering. BMC Syst Biol 4: 45.
- Wu WH, Wang FS, Chang MS (2011) Multi-objective optimization of enzyme manipulations in metabolic networks considering resilience effects. BMC Systems Biology 5: 145.
- Chen L (2016) Rational metabolic engineering and systematic analysis of Escherichia coli for L-tryptophan bioproduction, PhD thesis, TU Hamburg.
- Chen L, Zeng AP (2017) Rational design and metabolic analysis of Escherichia coli for effective production of L-tryptophan at high concentration. Appl Microbiol Biotechnol 101: 559–568.
- Chen M, Chen L, Zeng AP (2019) CRISPR/Cas9-facilitated engineering with growth-coupled and sensor-guided in vivo screening of enzyme variants for a more efficient chorismate pathway in coli, Metabolic Engineering Communications 9: e00094.
- Li Z, Wang H, Ding D, Liu Y, Fang H, et al. (2020) Metabolic engineering of Escherichia coli for production of chemicals derived from the shikimate pathway. Journal of Industrial Microbiology and Biotechnology 47: 525-535.
- Niu H, Li R, Liang Q, Qi Q, Li Q, et al. (2019) Metabolic engineering for improving L-tryptophan production in Escherichia coli. J Ind Microbiol Biotechnol 46: 55-65.
- Carmona SB, Flores N, Martínez-Romero E, Gosset G, Bolívar F, et al. (2020) Evolution of an Escherichia coli PTS−strain: a study of reproducibility and dynamics of an adaptive evolutive process. Applied Microbiology and Biotechnology 104: 9309–9325.
- Xiu ZL, Chang ZY, Zeng AP (2002) Nonlinear dynamics of regulation of bacterial trp operon: Model analysis of integrated effects of repression, feedback inhibition, and attenuation. Biotechnol Prog 18: 686-693.
- Chen L, Chen M, Ma C, Zeng AP (2018) Discovery of feed-forward regulation in L-tryptophan biosynthesis and its use in metabolic engineering of coli for efficient tryptophan bioproduction. Metab Eng 47: 434–444.
- Carlsson B, Zambrano J (2014) Analysis of simple bioreactor models - a comparison between Monod and Contois kinetics, IWA Special International Conference: "Activated Sludge - 100 Years and Counting". Essen, Germany.
- Noor E, Eden E, Milo R, Alon U (2010) Central Carbon Metabolism as a minimal biochemical walk between precursors for biomass and energy. Mol Cell 39: 809-820.
- Ruby EG, Nealson KH (1977) Pyruvate production and excretion by the luminous marine bacteria. Appl Environ Microbiol 34: 164-169.
- Kreth J, Lengeler JW, Jahreis K (2013) Characterization of pyruvate uptake in Escherichia coli K-12, Plos ONE 8: E67125.
- Loeblein C, Perkins J, Srinivasan B, Bonvin D (1997) Performance analysis of on-line batch optimization systems, Comput Chem Eng 21: S867-S872.
- Maria G, Dan A (2011) Derivation of optimal operating policies under safety and technological constraints for the acetoacetylation of pyrrole in a semi-batch catalytic reactor. Comput Chem Eng 35: 177-189.
- Bharat A (2013) Process analytical technology (PAT), Msc Diss P.D.V.V.P.F.S. College of pharmacy, Ahmed Nagar, India.
- Moraru I, Schaff JC, Slepchenko BM, Loew LM (2002) The Virtual Cell: An integrated modeling environment for experimental and computational cell biology. Ann N Y Acad Sci 971: 595-596.
- Avili MG, Fazaelipoor MH, Jafari SA, Ataei SA (2012) Comparison between batch and fed-batch production of rhamnolipid by Pseudomonas aeruginosa. Iranian journal of Biotechnology 10: 263-269.
- Trambouze P, Van Landeghem H, Wauquier JP (1988) Chemical reactors: Design, engineering, operation. Paris: Edition Technip.
- Rojanschi V, Ognean T (1989) Cartea operatorului din statii de tratare si epurare a apelor (Operator's manual working in the wastewater treatment and purification plants), Ed. Tehnica, 1989 (in Romanian).
- Peters M, Eicher JJ, Van Niekerk DD, Waltemath D, Snoep JL (2017) The JWS online simulation database. Bioinformatics 33(10): 1589-1590.
- Kanehisa M, Furumichi M, Sato Y, Ishiguro-Watanabe M, Tanabe M (2021) KEGG: integrating viruses and cellular organisms, Nucleic Acids Res 49(D1): D545–D551.
- EcoCyc (2005) Encyclopedia of Escherichia coli K-12 genes and metabolism, SRI Intl., The Institute for Genomic Research, Univ of California at San Diego.
- Maria G, Scoban AG (2017) Optimal operating policy of a fluidized bed bioreactor used for mercury uptake from wastewaters by using immobilized putida cells, Current Trends in Biomedical Engineering & Biosciences 2(4): 555594.
- Yang X, Mao Z, Huang J, Wang R, Dong H, et al. (2022) The necessity of considering enzymes as compartments 1 in constraint-based genome-scale metabolic models, BioRxiv – The preprint server for biology Cold Spring Harbor Lab (USA).
- Orth JD, Thiele I, Palsson BØ (2010) What is flux 826 balance analysis?. Nat Biotechnol 28: 245-248.
- Sotiropoulos V, Kaznessis YN (2007) Synthetic tetracycline-inducible regulatory networks: computer-aided design of dynamic phenotypes. BMC Syst Biol 9: 7.
137. Roubos J A (2002) Bioprocess modeling and optimization - Fed-batch clavulanic acid production by Streptomyces clavuligerus, PhD Thesis, TU Delft, 2002.
-
Gheorghe Maria. Application of (Bio)Chemical Engineering Concepts and Tools to Model GRC-s, and Some Essential CCM Pathways in Living Cells. Part 3. Applications in the Bioengineering Area. Arch Biomed Eng & Biotechnol. 7(5): 2024. ABEB. MS.ID.000671.
-
Hartree-Fock method, 1H NMR spectroscopy, Xalapa, UFF, PM3, EPR-II, GIAO Methods, Gauge-Independent Atomic Orbital, Optimization, Molecular structure
-

This work is licensed under a Creative Commons Attribution-NonCommercial 4.0 International License.


