 Research Article
Variability in the Short-Range Dispersion of Passive, Short-Duration Emissions
Alan Robins1*, Paul Hayden1, David Gallacher1,2, Sam Pace1, Hana Chaloupecka1,3
1Department of Mechanical Engineering Science, University of Surrey, United Kingdom
2Guys and St Thomas’ Hospital NHS Foundation Trust, United Kingdom
3Institute of Thermomechanics, Czech Academy of Sciences, Czech republic
Alan Robins, Department of Mechanical Engineering Science, University of Surrey, United Kingdom.
Received Date: March 02, 2021; Published Date: March 19, 2021
Abstract
The objective of this analysis was to use wind tunnel concentration measurements to describe the structure of dispersing clouds from an elevated source in a deep turbulent boundary layer and to develop scaling rules that reduce the results to a universal form. The experiments were carried out in a 1 m deep simulated atmospheric boundary layer in the EnFlo meteorological wind tunnel at the University of Surrey. Ensembles of between 100 and 200 repeat emissions were used, with emission durations between 0.067 and 1.02 s with the reference flow speed at the boundary edge of 2 ms-1. The fetch studied extended to about six source heights downwind (roughly, two boundary layer depths). The structure of the evolving clouds was analysed to determine time of flight, along-wind spread and dosage and to compare the dosage behaviour with the concentration field in a plume from the same source. This illustrated how the two were related and therefore how cloud dosage statistics (mean and standard deviation) could be derived from plume data. It also demonstrated that much larger ensembles were required to reduce the statistical uncertainty in the mean cloud properties. Consequently, the proof of the near-universal scaling presented is somewhat compromised. However, it is believed to be both relatively simple and adequate for practical applications. An application to a sequence of short- term releases at full-scale is demonstrated. The next steps involve testing these conclusions in a wider range of flow and dispersion conditions, namely in the presence of obstacles or complex urban areas.
Keywords: Boundary layer; Dosage; Mean; Short-Range Dispersion.
Introduction
Robins and Fackrell [1] presented a wind tunnel study of the dispersion of short duration, ground level emissions in a deep turbulent boundary layer, modelling the atmospheric boundary layer. This focused of comparison with the analytical theory developed by Chatwin [2]. Prior to that, Fackrell and Robins [3] had used the same techniques to study concentration fluctuations and fluxes in plumes from point sources. Here, the emphasis was the structure and development of the concentration field. In particular, the key differences between elevated and ground level plumes were investigated, one being the much greater level of fluctuating concentration in elevated plumes, and how this depended on distance from the source. The effect of source conditions, notably source size relative to the scales of the turbulent eddies, was treated in more detail in Fackrell and Robins [4]. Data from these studies has proved to provide challenging test cases for simulation by computational fluid mechanics.
Wind tunnel and water flume studies of concentration fluctuations in plumes continued, driven in many cases by practical requirements of understanding the hazard involved in the accidental (or deliberate) release of clouds of toxic material (e.g., Wilson [5], Hilderman et al. [6], Bergagni et al. [7]. The nature of concentration fluctuations, being bounded by zero at the lower end, leads to probability distributions of concentration that are highly skewed and finding models for the upper bounds of concentration levels, where the hazard lies, became a matter of some urgency.
Recent experimental work, say in the last 50 or so years, with short duration emissions can be conveniently divided between field work in the USA at the US Army Dugway Proving Ground and in Oklahoma City and wind tunnel simulations in Europe. Both have used urban or urban- like sites and open terrain. In parallel, there has been a great deal of activity, again at full and model scale, focussed on short duration, heavier than air releases (e.g., Hall & Waters [8], McQuain & Roebuck [9] but these are of little value here as behaviour is dominated by gravity spreading rather than ambient turbulence.
Yee et al. [10,11, 20] 1999 analysed data from the Dugway site, an open area of low surface roughness, using passive emissions from a source at height 2.5 m. Experiments were conducted over downwind fetches between about 200 and 1200 m under a wide range of atmospheric conditions, from very unstable to moderately stable stratification. Ensemble sizes varied from order 20 in the early work to order 200 in the later work, where off-centerline data was used to increase the ensemble size. Peak concentration and dosage were found to decay as x-3.6 and x-2.6, respectively. In general, the fluctuation statistics measured in dispersing clouds were qualitatively like those observed in dispersing plumes. The shapes of the time-averaged and crosswind profiles of concentration variance and dosage variance were qualitatively like those of the corresponding mean concentration and dosage, respectively.
Relevant work in Oklahoma City is reported in Doran et al. [12], Zhou and Hanna [13], Hanna et al. [14]. The experiments took place in 2003 and are referred to as JU2003. Data from 10 fast-response tracer samplers were used to examine crosswind and along-wind spread, the decay of tracer concentrations, and the retention of tracer. Three to six puffs were released in each of ten experimental periods and dispersion studied over fetches up to about 1 km. Median values of the along-wind dispersion parameter σx grouped into downwind distance ranges were described by a linear variation with distance, plus an initial ‘‘hold up’’ contribution of about 30-45m due to building effects. Little evidence was found to support the expected linear relationship between σx and puff travel time, which was thought to be due to the complex wind field in the heterogeneous urban canopy. Further analysis led to the parameterizations:

where the rate of growth, dσt/dt, was consistent with earlier puff observations in experiments over rural terrain. Linear spread was also found for the length scale:

Of course, the off-set terms must be site-specific and variability of individual cases around these averages could be large. The advection speed was seen to increases as the puff grew out of the canopy layer.
The DAPPLE project Wood et al [15] ran from 2002 to 2010 and treated short range dispersion in central London. Although the 15-minute releases used in the field work may not immediately appear to be ‘short duration’ in the present context, the variability in dispersion behaviour was substantial and a set of wind tunnel experiments was carried out to examine cloud dispersion and the causes of variability (Robins et al., 2007, unpublished note). Some simple correlations for cloud travel time, T, rise and fall time, T50, and advection speed, Uc, were found as a function of fetch, R, showing that over the fetch studied, R < 12h, T increased linearly with R, T50/T was of order 1/3, and Uc was approximately a half the roof-level wind speed, Uh, where h is the average building height.
Leitl [16] report a detailed wind tunnel study using a 1:300 scale model of the Oklahoma field site with emission durations between 0.3 and 2 s and reference velocities in the range from 2.4 to 4.2 ms-1. The experiments investigated the validity of standard puff scaling parameters, using ensembles of order 200 to 400 to ensure good convergence of statistical properties. This demonstrated that the dosage and the peak concentration for a constant release duration were linearly correlated to the released volume of trace gas, and that the characteristic time scales were independent of the released volume. Further, the dosage and characteristic times in a puff were shown to be inversely proportional to the reference velocity and the peak concentration independent of reference wind speed. A threshold-based criterion was used to ensure that arrival times were independent of release durations.
Chaloupecka [17,18] describe wind tunnels work with a regular array, representing an idealized urban area, and using release durations of 1 s (plus some additional work with durations between 0.5 and 10 s) with a 6.5 ms-1 reference wind speed. The focus was on the prediction of arrival time. Ensembles between 100 and 600 in size were used to obtain statistically representative datasets and methods developed to determine reliable arrival time data. Attention was also given to the dependency of cloud structure (i.e., puff or plume-like) on release duration. A novel method was presented by which concentration signals were divided into three cloud phases: the arrival, the central and the departure phase. The characteristics (e.g., duration, mean concentrations) of the individual cloud phases were then explored. The results indicate that the finite-duration releases for which the central cloud phase exists have a plume- like behaviour in this region. The most reliable evaluation of arrival time was based on threshold criteria set from prior plume experiments.
Objectives
In this paper, we address the short-range dispersion of pollutant clouds emitted from elevated sources, a matter that has become of topical concern. The objective was to use wind tunnel concentration measurements to describe the structure of the dispersing clouds and to develop simple scaling rules that reduce the data to universal forms and can therefore be used in a predictive manner.
Methods
The data were collected in the Environmental Flow wind tunnel at the University of Surrey as part of a larger study of short-range dispersion in complex environments Woodward et al. [19], which also contains a short description of the methodology. The wind tunnel has a working section that is 20 m long and 3.5 x 1.5 m in cross-section and was designed specifically for the laboratory scale study of atmospheric boundary layer processes. In this work, hydrocarbon tracer gas was released from a small source (internal diameter 7.6 mm, height h= 320 mm), mixed with a carrier gas to ensure passive conditions (no excess momentum, neutral buoyancy), into a 1 m deep, turbulent boundary layer. This was generated by Irwin spires at the entrance to the 20 m long test section, plus three-dimensional flat plate floor roughness elements. The friction velocity and roughness length were 0.055Uref and 0.001H, respectively, where Uref, the reference speed, was 2ms-1 and H, the boundary layer depth, 1m. Concentration measurements were made with a Cambustion HFR400 Fast Flame Ionisation Detector (FFID) that had a spatial resolution of the order of 1 mm and a frequency response of about 200 Hz, the output being sampled at 400 Hz. The results to be discussed were obtained downwind of the source (0, 0, h; h/H = 0.32), in planes at x/h = 1.125, 1.875, 2.625, 3.375 and 5.625. The short duration emissions were essentially ‘off-on-off’ at the source, with nominal durations of 0.05, 0.1, 0.25, 0.5 and 1 s; these were repeated between 100 and 200 times to ensure a sufficient ensemble of results for calculating reliable dispersion statistics. Some measurements were also made in continuous emissions, ‘continuous’ implying that the release was sufficiently prolonged that reliable statistics could be calculated once the plume had been established.
Table 1 lists the key parameters describing the releases, as derived from a set of FFID measurements taken on the centerline, one source diameter from the plane of release and using the same source configuration and operating conditions as in the main experiments. Ensembles of 58 repeat emissions were used and repeatability in all the key parameters was found to be very high, e.g., the standard deviation of the dosage, D, varied between 3% for the shortest durations to 0.5% for the longest, where:

Table 1: Specification of the source conditions.

A displacement method was used to make separate measurements of the total volume released and results were within a few percent (at worst) of the values derived from the FFID data.
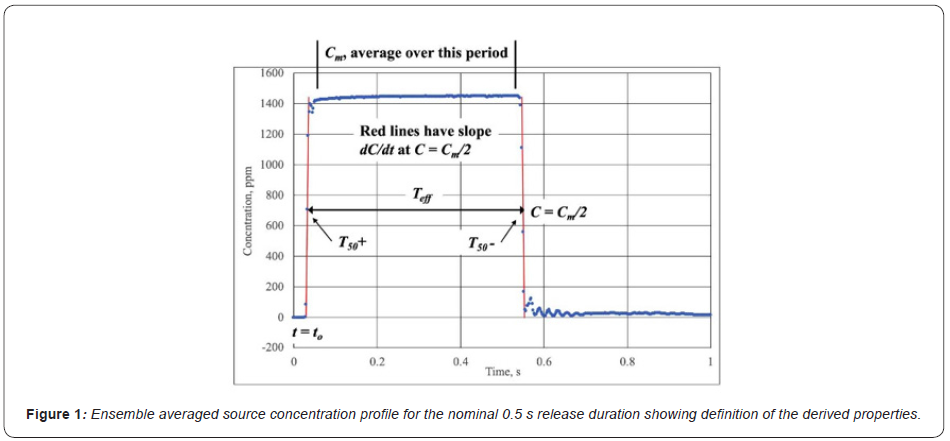
The ensemble-averaged concentration time series were analysed to obtain the mean plateau concentration, Cm, and then the time at which 50% of this value was observed at the rising and falling edges and The time interval between the two, defined the effective release duration, Teff. Ts is the nominal release duration, as demanded by the control software in all cases there is a fixed difference of 0.016 to 0.017 s between the two. The process is illustrated in Figure 1, which shows the release profile for the Ts = 0.5 s case. The limits used to average the plateau signal were set by eye – an automatic process could have been designed but there was no great value in doing so, given the small number of cases to be analysed. The same method was used in analysing the clouds as they developed downstream (Figure 1).
The rise and fall time scales were essentially equal and independent of Ts; they were defined from Cm and dC/dt at the 50% point - for example:

An arrival time was obtained in a similar manner and corrected for the advection time from the exit plane to the FFID inlet. The more-or-less constant value that this gave was essentially the time taken for the sample to pass through the sample tube to the FFID flame chamber (25 ms), implying that the release began immediately on demand and that the excess duration (Teff - Ts) was a result of the valve closing process. The tracer release volume, Q, was derived as the product of Teff and the tracer release rate, q, of 0.113 mls-1. Cm was typically 4% lower than the value derived from the tracer and total release rates, consistent with the expected accuracy of the flow control systems at the low flow rates involved. Finally, the sharpness of the release profiles is measured by the ratio of the rise time to the emission duration and varied between 10% for the shortest emission to slightly less than 1% for the longest.
Results
Ensemble averages
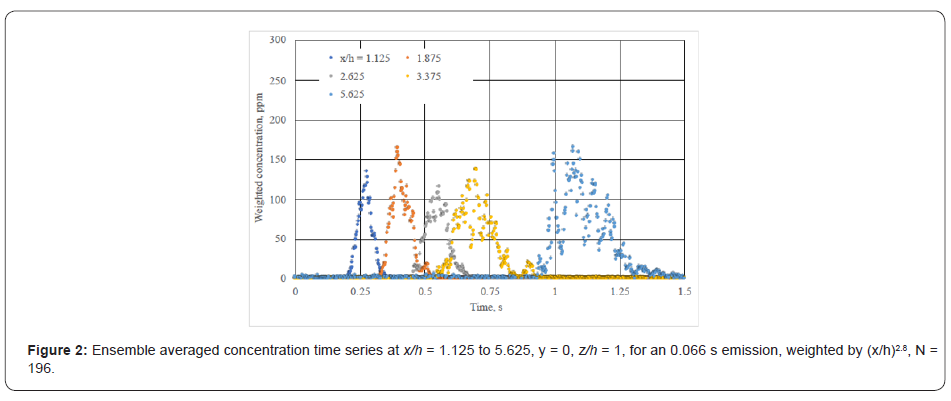
Figure 2 shows ensemble averaged centerline concentration time-series at x/h = 1.125, 1.875, 2.625, 3.375 and 5.625 for the 0.066 s release duration, the concentration data being weighted by (x/h)2.8 to counter the rapid decay in concentration with downwind travel. Although linear short-range spread would lead to an exponent of 3, 2.8 proved to be more successful in scaling the data. Apart from the obvious increase in plume spread with travel, the striking feature is that ensembles of order 200 repeat experiments are insufficient to provide ‘clean’ profiles, devoid of significant variability about the mean. This is a clear reflection of the high level of variability that develops in a dispersing cloud of material as it moves away from the source, where fluctuation levels are ideally zero. Plume data make this abundantly clear.
Note that the decay exponent, 2.8, is much less than the value of 3.6 quoted by Yee et al. [10]. This arises from the fundamentally different manner in which the data was obtained. Here, we adopted an Eulerian approach, measuring properties with a single detector at a number of fixed locations. Yee et al., however, used crosswind lines of detectors and analysed the data in a Lagrangian framework. This removes the contribution from large scale eddies to ‘meandering’ and focusses on the smaller scales that are comparable with the cloud dimensions. Both are valid point of view, though leading to different conclusions concerning matters such as decay rates, etc.
A time-series at x/h = 1.125 from a continuous release can be seen in Figure 3, where the mean value is shown in red. Two features shine through, the very large departures above the mean value (large skewness in the probability distribution) and the intermittency in the signal (i.e., periods of zero concentration), and this on the centreline. These characteristics of the signal are typical of near-source behaviour (see for example, Yee et al. [17], Bergagni et al. [2]). Table 2 summarizes the development of a number of statistical properties with increasing fetch downwind from the source.
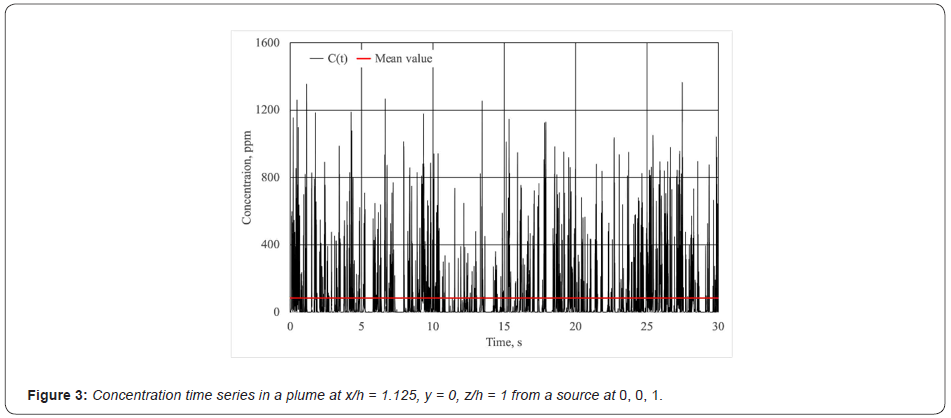
Table 2: Statistical properties of the plume from a continuous emission at z = h, y = 0.

Here, z is height above the ground, y lateral distance from the centerline, c’ the standard deviation of the signal, C the mean, and the intermittency is defined as the probability of source material being observed (measured relative to a threshold of 1 ppm, which proved a robust definition). This is typical of near-field behaviour downstream of a small source in turbulent flow (e.g., see Fackrell and Robins [4]. Fluctuation levels are zero at the source but grow rapidly as the emitted material ‘meanders’ in the large eddies of the turbulence and the internal structure is broken-up by the smaller eddies. The net result is increasing fluctuation values relative to the mean and decreasing intermittency. Obviously, this process also acts on the short duration emissions, with the added component to the variability being along-wind turbulence.
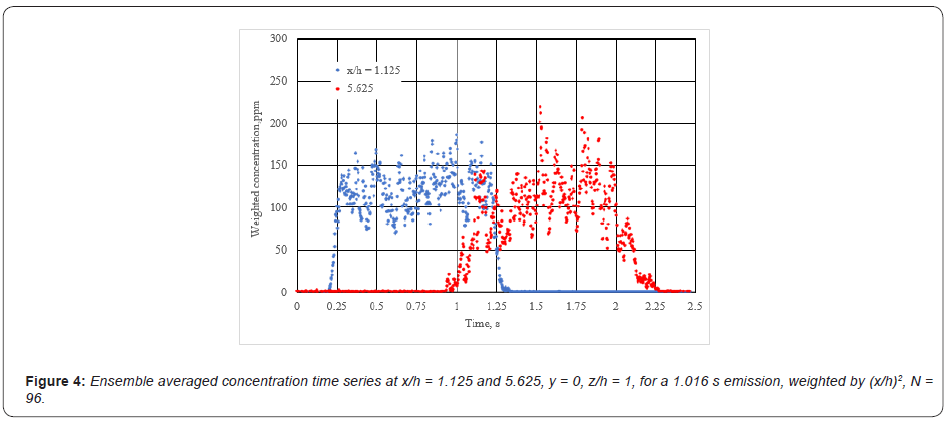
This is perhaps most easily seen in the longest duration emissions, as these maintain a ‘plateau’ region at all distances examined, as can be clearly seen in (Figure 4) which for sake of clarity only shows results at x/h = 1.125 and 5.625, the ensemble averages being formed from about 100 repeat releases. These results have been weighted by (x/h)2, which is appropriate to the plume- like behaviour of the plateau region. More sophisticated weighting could be used, based on plume dispersion theory, but this would not be consistent with the current objectives. Note that ensemble averaging has removed intermittency in these series and greatly decreased the level of the fluctuations relative to the mean. This can be explored further from the continuous release results by extracting 15 independent 1 s samples from the 30 s timeseries, forming the ensemble average, and comparing the statistics with those of the original series and the plateau regions of the 1 s emissions. Results are presented in Table 3 – for brevity, only three locations are listed, though the outcome is the same at all; N is the number of series making up the ensemble averages.
Table 3: Statistical properties of 1 s ensemble averages at z = h, y = 0.

As an example, at x/h = 1.125 c'/C = 2.10 in the continuous series, 0.558 in the ensemble average of the 1 s samples (N = 15) from that series and 0.189 in the plateau region of the ensemble average of the 1 s emissions (N = 96). Note that 2.10/√15 = 0.54 and 2.10/√96 = 0.21 a demonstration that the sampled series were independent and a consistency check on the data. On this basis, the number of repeats needed to reduce the plateau region fluctuation intensity to, say, ten percent lies between approximately 400 and 900 for the data in the tables. If emphasis was needed, then this shows starkly the issues faced in obtaining reliable statistics at short range with short duration emissions, whether by computation or experimentation. The standard error in the time series for the continuous emission lies between 6 and 9% - our usual target is 2%, which would imply a series of length 4.5 to 10 minutes, or the acceptance of larger standard errors, as was done here.
Dosage levels
Given the high level of variability in the ensemble averaged results, there will be considerable variability in the dosage levels from the individual clouds. As noted above, we define dosage as:

where the integration limits encompass the passing of the cloud or the exposure time, TE, in a continuous emission. The evolution of dosage variability is discussed later, but as might be expected it was greatest for the shortest emissions (Ts = 0.066 s, Ts* = 0.41), least or the longest (1s, 6.35), where Ts* is the dimensionless emission duration, UrefTeff/h, where Uref is the free- stream wind speed. Next, the time of flight, T, is considered, this being derived from the zeroth (the dosage) and first moment of the concentration timeseries.

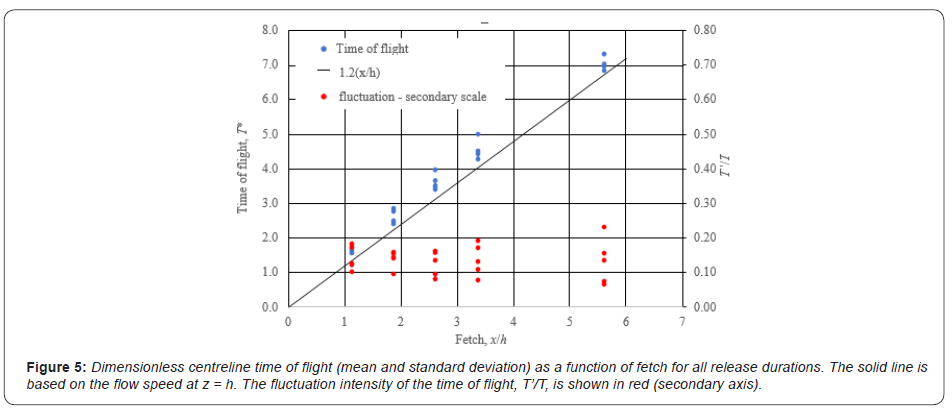
The final two terms correct for the zero offset (Table 1) and the time origin being based on the leading edge of the emission, not its centroid. T is plotted in dimensionless form, T* = UrefT/h, in Figure 5 as a function of fetch downwind. No differentiation is made between the release durations as the results collapse. The straight line, T* = 1.2(x/h) is based on the flow speed at the height of the source, showing that the clouds tend to move at a slightly slower speed, a reflection perhaps of the vertical extent of the clouds through the boundary layer. The secondary scale shows that the fluctuation level of the time of flight is typically about 15%. It must be emphasized though that these correlations, as the others above and below, cannot be assumed to hold far outside of the range investigated.
Knowing the time of flight, we can now focus on the alongwind spread σt in the time series examined above. Short-range dispersion theory for homogeneous conditions predicts that the along-wind spread σx is given by:

which leads to:


This form reduces error due to noise in the signals but with the high level of variability in the ensemble averages still returns an estimate with a high standard error. The final term is the contribution due to the emission duration and, in most cases, this was much larger than σt2 . In fact, it was not possible to determine the spread in all of the cases. The data give the spread constant to be 0.15 ± 0.043, to be compared with 0.12 from the flow data, which has a much lower standard error of about 5%. Including the shear driven spread in the expression for σt has no significant impact for the elevated release considered here (h/HBL = 0.32).
An alternative approach would be to fit a profile and derive the spread from the fitting process. The most likely candidate is a pair of error functions, as this correctly has the asymptote of a Gaussian puff when T » Ts, and becomes plume-like when Ts » T. However, the variability in the ensemble averages again makes the fitting very imprecise.
A dimensionless mean dosage, D*, can be defined as:

where Q is the total tracer emission, equal to Teff q. Firstly, in explanation of this form, we note that D/Teff is independent of Teff and returns the mean plume concentration, as demonstrated by Table 4, where the dimensionless dosages from the short duration emissions are compared with the dimensionless concentrations in a plume from the same source.
Table 4: Comparison of dimensionless dosage and dimensionless plume concentration.

The agreement is not perfect, on average the plume results are 7% lower than those for the short duration emissions and the two are generally closer for the longer duration emissions and at larger fetches from the source. Dosage decays more slowly than concentration in the dispersing clouds because of time integration removing the effects of a long-wind dispersion. The obvious scaling to remove the decay with distance is (x/h)2, as was previous used to weight concentration in the clouds with plateau regions. The outcome is presented in Figure 6,, where results are again compared with plume data. The collapse is perhaps somewhat better than might be anticipated from Table 3 and the scaling may clearly prove useful in practice Figure 6.
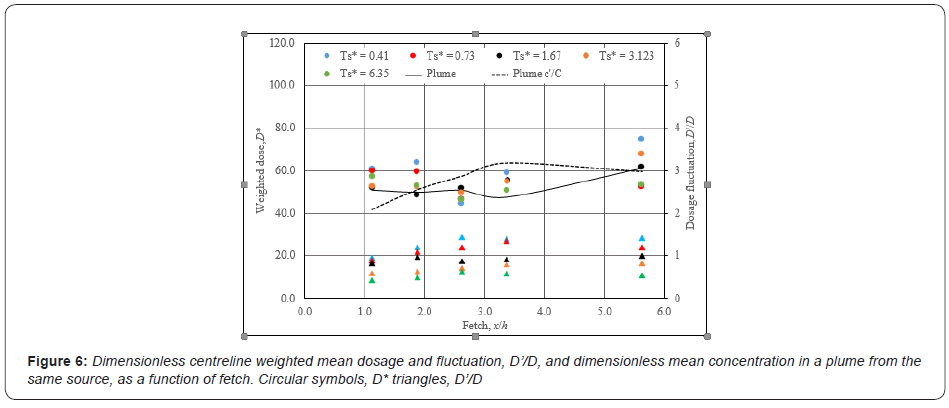
The dosage fluctuation levels, D'/D, are also shown and these lie in a range between about 1.5 and 0.5 with the expectation that values would converge downwind, as cloud spread, rather than source duration, defines the time scale of the clouds. Concentration fluctuation levels, c'/C, are much greater, as has already been noted. If the values of D'/D are assumed to be a good estimate of the true values, then the number of repeats necessary to reduce the standard error to any given level can be estimated. For example, to drive the standard error below 5% would require about 900 repeats of the shortest emission and about 200 of the longest; for 10% the numbers would vary from 300 to about 50. This is considerably fewer than the numbers needed to reduce the standard error in the mean plateau concentration to 10% (see Section 3.1).
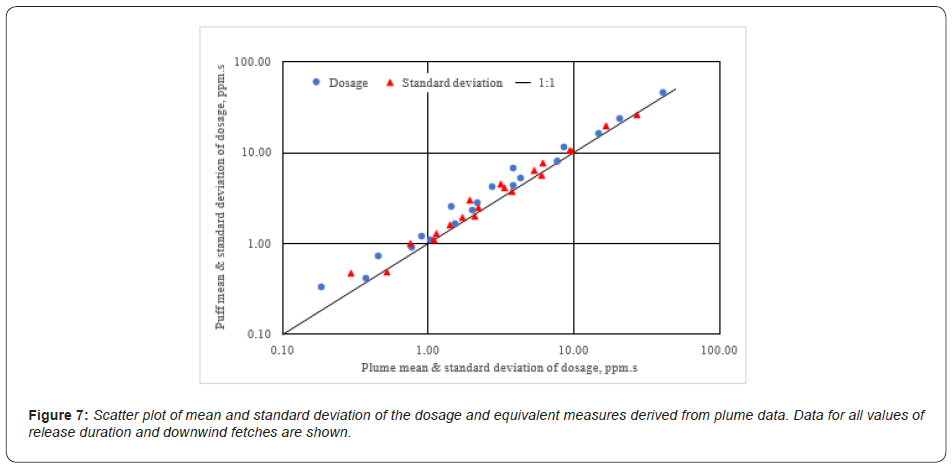
The relationship between cloud dosage and plume concentration was pursued further to demonstrate the value in using plume data to derive cloud dosage data. The plume concentration time series was divided into a number of sub-series of lengths corresponding to the effective cloud release durations. The ensembles thus obtained were then processed in the same manner as the cloud data. The results could be compared directly as the emission rates were the same in both cases. The outcome is shown in Figure 7, which is a scatter plot of the mean and standard deviation of dosage in the clouds with the equivalent values derived from the plume time series. Firstly, we note that there is very little sign of bias in the comparison of the standard deviation values. This is not true of the mean values, where there is a clear bias at small values (large x/h) with the values from the puffs larger than those from the plume. This is a reflection of the differences already seen in Figure 6.
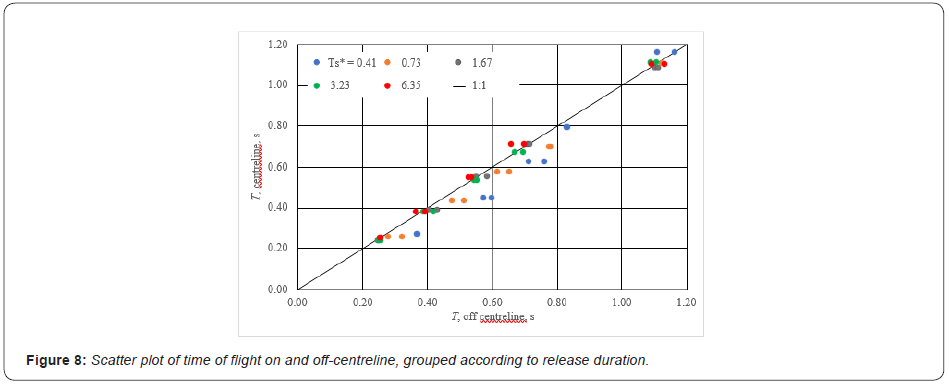
(Figure 7) So far, we have tacitly assumed that off-centerline dosages can be estimated from the centerline dosage and the lateral and vertical concentration profiles of the plume. These assumptions are now tested from the available off-centerline data. Firstly, the travel times across the lateral profile at z/h = 1.0 are compared with the centerline values in the scatter plot shown in Figure 8 results are colour-coded by release duration; the groups correspond with fetch downwind. Agreement with the 1:1 line is acceptable, though there is a tendency for the off-centerline values for the shortest duration emissions to be somewhat larger than the centerline values. The pattern is not entirely consistent and disappears at large times of flight (large x/h). Clearly, though, a good working hypothesis is that the arrival time is a function of x only (Figure 8).
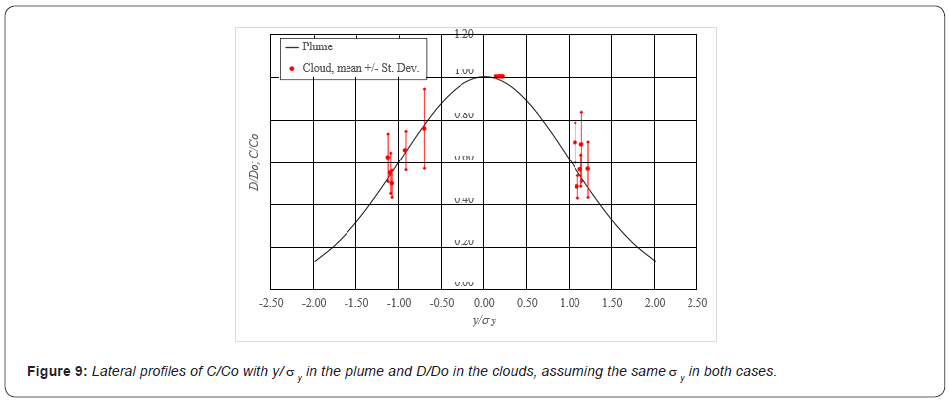
Next, using the lateral spread in the plume to form the dimensionless lateral position, y/we can test the assumption that the lateral profile of dosage, D/Do, is the same as that of concentration in the plume, C/Co., where the suffix ‘o’ denotes the centerline. This is shown in Figure 9, where the mean value of D/Do plus or minus one standard deviation is plotted. Each mean value was derived from the values at a given lateral location for each of the five release durations. What is clear is that there is considerable scatter about the fit, scatter that had no particular dependence on x/h or Ts and would seem to be largely the result of insufficient. ensemble size. It is reasonable to conclude that using the lateral profile of C/Co from the plume is a good working hypothesis
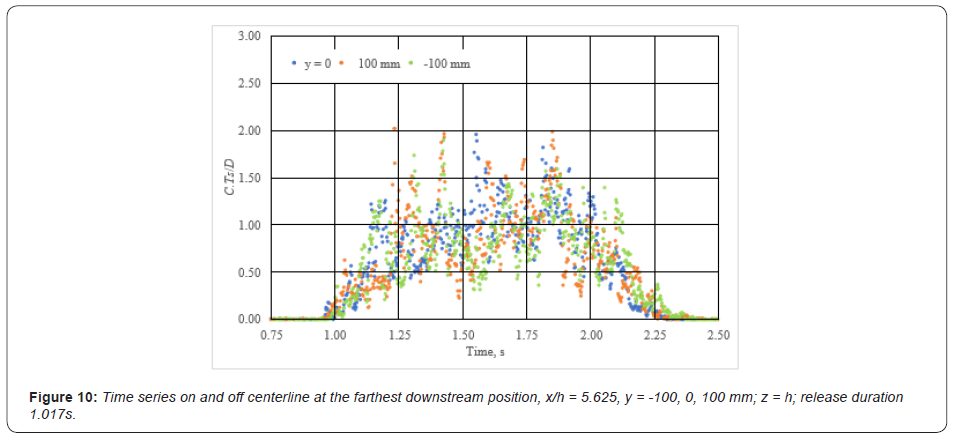
The final test would be to compare concentration time series on and off-centerline to demonstrate their correspondence. From what has already been concluded, it might be expected that this would the final link in the chain, but sampling noise due to ensemble size makes the outcome less obviously convincing. As an example, Figure 10 shows three ensemble averaged series (N = 96) at x/h = 5.625, one on the centerline and the others 100 mm to each side (y/ σy = ± 0.88) for the longest duration release. Concentrations have been normalised as CTeff/D, to remove variations in magnitude due to lateral position and enable a direct comparison of the time series. Probably the best that can be said, is that the comparison, typical of all those examined, does not disprove the assumption – but conclusions are compromised by the high level of fluctuations about the true ensemble averaged profiles.
Dispersion regimes and repeated emissions
First, some comment on the structure of dispersing clouds. Near the source, where Ts > Tf, the cloud has a plateau region – we might term this as being plume-like (but with end regions of course). Further downwind, where Tf » Ts, the structure becomes puff-like as longitudinal spread has fully eroded the plateau region. How quickly this is established depends on the level of ambient turbulence and shear. Between these two limiting regions, there is an intermediate regime, where the emission should perhaps be simply referred to as a cloud. Of course, the boundary condition at the underlying surface can become an important factor as material from an elevated emission spreads downwards, which complicates the simple arguments used here.
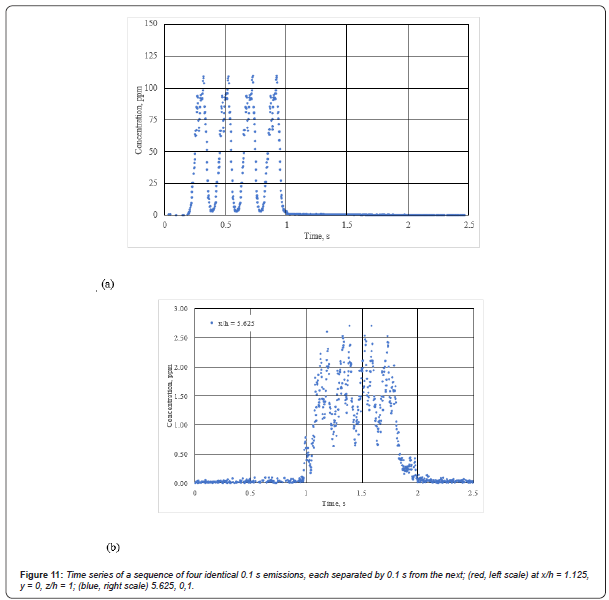
Finally, we consider a continuous sequence of emissions that is comprised of short duration emissions with a period of zero emission between them. Only ensemble averaged behaviour can be discussed and what is expected is that the initial series of separate clouds eventually merge into a plume-like structure as longitudinal spread fills the region between the individual clouds. The expectation is that this will generally take place in the cloud/puff regime of dispersion. The time scale for merging, Tm, is such that Tm » Tso, where Tso is the time interval between the individual emissions. Figure 11 illustrates the process. Here, the ensemble averaged concentration profile of the 0.116 s release has been used and four releases combined with an interval of 0.116 s between each of them. At x/h = 1.125 the four emissions are essentially separate, which is to be expected as = 0.027 s ( < Teff). However, combination is well advanced at x/h = 5.625, where = 0.13 s ( > Teff). So, a sequence of emissions starts in the plume regime, passes though the cloud and, possibly the puff regimes before becoming a plume once again [20]. An implicit assumption in developing this analysis is, of course, that emissions are indeed passive, enabling concentrations to be added (Figure 11).
As an example, consider the application of this is to exhalation that is contaminated with a virus. Conversion from wind tunnel to full scale conditions is through dimensionless coordinates and dimensionless dosage. For time, this amounts to equality of T* = Ut/h, leading to:

where the suffix, m, denotes model scale. As an example, take t to be 4 s (15 breaths per minute) and the length scale ratio 1:100, so that:

Clearly the data presented here covers the range required. This is but a start, of course, as exhaled air is warm and carbon dioxiderich and dispersion takes place in the wake of an individual. In open air and a turbulent crossflow, the latter may prove to be the more important.
Conclusions
The objective was to use concentration measurements to describe the structure of dispersing clouds and to develop scaling rules that reduce the data to a universal form. Although this was not fully achieved, the near-universal scaling presented here is believed to be both relatively simple and adequate for practical applications. The next step is to test this in a wider range of flow and dispersion conditions, namely in the presence of obstacles or complex urban areas.
The main conclusions from this work are:
- Near the source, where the emission duration exceeds the time of flight, Teff > T, andthe cloud has a plateau region defined as plume-like, but with end regions. Downwind, where T » Teff, the structure becomes puff-like. Between these two limiting regions, there is an intermediate cloud dispersion
- A high degree of variability was apparent in ensemble averages formed from 100 to 200 repeat experiments; analysis showed that ensembles of between 400 and 900 repeats would be needed to reduce the variability to acceptable levels. The high levels of intermittency in individual time series or in the plume from a continuous release disappeared under ensemble averaging and fluctuation levels decreased relative to those in the plume by factors of √N, N being the number of observations forming the ensemble.
- The time of flight increased linearly with fetch but was slightly greater than that implied by the mean wind speed at the source height. Fluctuation levels were only weakly dependent on emission duration and were of the order of a standard deviation of 15% of the time of flight. The along-wind spread in the time series was shown to be reasonably well predicted from the turbulence intensity at source height in the approach flow.
- The cloud peak or plateau concentrations decayed as (x/h)-n, with n varying from 8 in the puff regime, to 2 in the plume-like regime.
- A reliable estimate of centerline dosage from a passing cloud can be made from the product of concentration in a plume with the same emission rate, and the emission duration. Dosage fluctuation levels depended on the dispersion regime, being greatest for puffs (standard deviation of 150%) and least for long emissions (50%). It is expected that these values will converge once along-wind spread dominates emission duration and all releases enter the puff regime. This analogy can be extended to the standard deviation of the
- Ensemble sizes required to drive the standard error in the mean dosage to below 10% varied from about 300 for the shortest emission duration to 50 for the
- As a good working hypothesis, the travel time is independent of lateral position, and by supposition vertical position and the profile on D/Do in a cloud the same as that of C/Co in a plume. The ensemble average concentration time series on the centerline can be used to derive that at an off-centerline
- Merging occurs in a series of identical emissions separated by an interval Tso. The time scale for merging, Tm, is such that Tm » Tso.
The main caveats on these conclusions are:
1. They apply to a source well above the surface, where shear can be ignored, at least to first order. This also implies that the surface boundary condition has no significant impact on the dispersion process and that, in turn, implies a fetch limit, typical that x/h is less than about 10.
2. Only one source diameter was investigated, and it is wellknown that concentration fluctuation levels in plumes are very sensitive to source size. Here, dosage fluctuation levels also depend on emission on duration.
Acknowledgement
The experimental work was funded by the UK Atmospheric Dispersion Modelling Liaison Committee, under contract ADMLC/2019-01.
Conflict of Interest
None.
References
- Robins AG, Fackrell JE (1998) An experimental study of the dispersion of short duration emissions in a turbulent boundary Transactions on Ecology and the Environment 21: 697-707.
- Chatwin, PC (1968) The dispersion of a puff of passive contaminant in the constant stress region. Quart. J. R. Met. Soc 94: 350-360.
- Fackrell JE, Robins AG (1982) Concentration fluctuations and fluxes in plumes from point sources in a turbulent boundary layer. J. Fluid Mech 117: 1-26.
- Fackrell JE, Robins AG (1982b) The effects of source size on concentration fluctuations in plumes. Boundary Layer Met 22: 335-350.
- Wilson DJ (1995) Concentration Fluctuations and Averaging Time in Vapor Clouds, Center for Chemical Process Safety of the American Institute of Chemical Engineers, New York.
- Hildermann TL, Hrudey SE, Wilson DJ (1999) A model for effective toxic load from fluctuating gas concentrations. J. Haz. Mat., A 64: 115-134.
- Bertagni MB, Marro M, Salizzoni P,Camporeale C (2020) Level-crossing statistics of a passive scalar dispersed in a neutral boundary layer. Atmospheric Environment 230: 117518.
- Hall DJ, Waters RA (1985) Wind tunnel model comparisons with the Thorney Island dense gas release field trials. J Haz. Mat 11: 209-235.
- McQuaid J, Roebuck B (1985) Large-scale field trials on dense vapour dispersion. Rep. No. 10029, Comm. Eur. Communities, Brussels 179-189.
- Yee E, Chan R, Kosteniuk PR, Chandler GM, Biltoft CA, et al. (1994a) Experimental measurements of concentration fluctuations and scales in a dispersing plume in the atmospheric surface layer obtained using a very fast response concentration detector. J. Appl. Meteorol 33: 996-1016.
- Yee E, Chan R, Kosteniuk PR, Chandler GM, Biltoft CA, et al. (1994b) Concentration fluctuation measurements in clouds released from a quasi-instantaneous point source in the atmospheric surface layer. Bound. Layer Meteorol 71: 341-373.
- Doran JC, Alwine KJ, Flaherty JE, Clawson KL, Carter RG (2007) Characteristics of puff dispersion in an urban environment. Atmos. Environ 41: 3440-3452.
- Zhou Y, Hanna SR (2007) Along-wind dispersion of puffs released in a built-up urban area. Bound. Layer Meteorol 125: 469-486.
- Hanna S, Chang J, Mazzola T (2019) Comparison of an Analytical Urban Puff-Dispersion Model with Tracer Observations from the Joint Urban 2003 Field Campaign. Boundary-Layer Meteorology 171: 377-393.
- Wood CR, Arnold SJ, Balogun AA, Barlow JF, Belcher SE, et al. (2009) Dispersion experiments in central London - The 2007 dapple project. Bull. Amer. Meteor. Soc 955-969.
- Berbekar E, Harms F, Leitl B (2015) Dosage-based parameters for characterization of puff dispersion results. Journal of Hazardous Materials 283: 178-185.
- Chaloupecká H, Janour Z, Miksovsky J, Jurcáková K, Kellnerová R (2017a) Evaluation of a new method for puff arrival time as assessed through wind tunnel modelling. Process Saf. Environ. Prot 111: 194-210.
- Chaloupecká H, Kluková Z, Kellnerová R, Janour Z (2021) Characteristics of Toxic Gas Leakages with Change in Duration. Atmosphere 12(1): 88.
- Woodward H, Gallacher D, Robins A, Seaton M, ApSimon H (2020) A review of the applicability of Gaussian modelling techniques to near-field dispersion. In Atmospheric Dispersion Modelling Liaison Committee Report.
- Yee E, Kosteniuk PR, Bowers JF (1998) A study of concentration fluctuations in instantaneous clouds dispersing in the atmospheric surface layer for relative turbulent diffusion: basic descriptive statistics. Bound. Layer Meteorol 87: 409-457.
-
Alan Robins, Paul Hayden, David Gallacher, Sam Pace, Hana Chaloupecka. Variability in the Short-Range Dispersion of Passive, Short-Duration Emissions. 4(2): 2021. ABBA.MS.ID.000584. DOI: 10.33552/ABBA.2021.04.000584.
Boundary layer, Dosage, Mean, Short-Range Dispersion
-

This work is licensed under a Creative Commons Attribution-NonCommercial 4.0 International License.


