


 Research Article
The Impact of Significant Digits in Bioequivalence Studies
Received Date: March 29, 2021; Published Date: May 28, 2021
Abstract
In biomedical research, various statistical methods are used to analyze data collected from studies to provide statistical inferences of the unknown parameters of interest. The analysis results up to a few decimal places are usually obtained for scientific validity. The use of different number of decimal places, however, may alter the conclusion of the analysis results. A typical example is the assessment of bioequivalence for generic approval in bioequivalence studies. In practice, there is no uniformly accepted cut-off standard for the numbers of decimal places in biomedical research. In this paper, following the concept of signal-noise in quality control and assurance, we propose a simple procedure in determining the number of decimal places for providing a valid statistical inference and assurance in biomedical research. Based on a non-central t distribution, the proposed procedure is able to control the largest rounding error when considering rounding up the data to certain decimal places. In other words, the proposed method could control the worst possible error adjusted for standard deviation by selecting an appropriate digit that meets the criteria that the non-central parameter is less than a pre- specified critical value. Statistical justification of the proposed procedure was provided and illustrated through a simulated dataset.
Keywords: Analytical Research; Decimal Places; Non-Central t Distribution; Transformation
Introduction
In drug research and development, both non-clinical and clinical studies are often conducted for assessment of treatment effect of the drug product under investigation. In practice, analysis results up to a few decimal places for scientific validity are usually obtained. However, there is no uniformly accepted standard regarding how many decimal places should be used for scientific validity. As an example, the latest version of the AMA Manual of Style only requires interception to reflect the original accuracy of measurement and the original precision of calculation (Committee, AMA, 2020), and the Publication Manual of APA generally recommends keeping one to three rounding decimals in different situations (American Psychological Association, 2020). Therefore, rounding numbers play an essential role in biomedical research, where analysis results must be very accurate for maintaining scientific validity.
For another example, in the assessment of bioequivalence (BE) for generic approval, it is required that the constructed 90% confidence interval of the geometric mean ratio falls entirely within the bioequivalence limit of (80%,125%) with no decimal place, (80.0%, 125.0%) with one decimal place, or (80.00%, 125.00%) with 2 decimal places. Thus, if the constructed confidence interval is marginally significant, the selection of decimal places could alter the conclusion of bioequivalence assessment. For example, suppose that the constructed 90% confidence interval is (79.956, 125.012). If one decimal place is selected, the 90% confidence interval is given by (80.0%, 125.0%) after rounding up to the first decimal place, which falls within the bioequivalence limit of (80.0%, 125.0%) entirely. Hence, we conclude that the test product is bioequivalent to the reference product. If two decimal places are selected, the 90% confidence interval becomes (79.96%, 125.01%) after rounding up to the second decimal place, which does not fall within the bioequivalence limit of (80.00%, 125.00%). Consequently, we fail to demonstrate bioequivalence between the test product and the reference product. Thus, the use of different decimal places may lead to different conclusions.
Following the concept of signal-noise introduced by Chow (2000), the appropriate number of significant digits for analytical results that satisfy two conditions would be selected. First, there is no significant difference between the truncated data with the raw data. Second, any data with fewer digits would not meet the first condition. In other words, after obtaining analytical results from statistical experiments, the optimal decimal place we should preserve is the smallest digits that could retain the same statistical analytical results as before. In this article, statistical properties and justification for Chow’s proposal for selection of appropriate decimal places are studied. The method proposed in this article aims to help determining the number of decimal places in biomedical research such as bioequivalence assessment for generic drugs and bio similarity assessment for biosimilar drug products. At the same time, it provides a user-friendly and simple way to obtain statistical inference while achieving the desired accuracy and precision. The proposed procedure is also very helpful in basic research such as drug discovery when making a critical go/no-go decision. The next section defines significant digits (decimal places) and bioequivalence testing. The proposed procedure for the determination of significant digits is briefly outlined in Section 3, which is illustrated through a numerical study in Section 4. In the Section 5, statistical properties and justification of the proposed procedure are studied. An application of bioequivalence study is given in Section 6. Concluding remarks are provided in the last section of this article.
Simulated Examples on Number of Decimal Places
As indicated in the FDA guidance on bioequivalence study, the 90% confidence interval of the geometric mean ratio between a test product and a reference product is regarded as the indicator to for evaluation of bioequivalence (FDA, 2003; FDA, 2006; Chow and Liu, 2008). Meanwhile, there are two different boundary and calculated methods for the 90% confidence interval of raw data and log-transformed data, respectively. To demonstrate that observations with different digits will lead to different conclusions, (Table 1) gives a simulated Cmax dataset with 24 subjects from a parallel-group bioequivalence trial comparing a test product with a reference product. The simulated data were generated from normal distributions 𝑁 (1.3,0.12) for the test drug 𝑋 and 𝑁 (1.0,0.12) for the reference drug 𝑌. In addition, the BE analysis is performed based on the raw data (no log-transformation data) through the confidence interval approach, and bioequivalence would claim if and only if the 90% confidence interval constructed by the mean difference of reference and test drug covered by interval (−0.2μR ,0.2μR ) , where 𝜇R is the mean of the reference treatment or drug.
Therefore, the BE limit of this example is (−0.2, 0.2), and the BE analysis should reject bioequivalence because the real difference between the mean of test and reference drugs is 1.3 − 1.0 = 0.3. As can be seen, (Table 2) summarizes the confidence intervals of Cmax data with different decimal places. However, different decimal places of observations lead to different bioequivalence conclusions. Thus, if we do not keep enough decimal digits, we could falsely conclude BE. To indicate that the BE limit with different digits will also cause different results, (Table 3) provides some possible scenarios of the exponential confidence interval of log-transformed data and the BE study results. The bioequivalence for log-transformed data will imply when the exponential confidence interval [eL, eU] is covered by [80%,125%], where [𝐿, 𝑈] is 90% confidence interval of transformed treatment effect. (Table 3) illustrates the impact of significant digits of the BE limit, which could also mislead the BE analysis.
Proposed procedure of Observations Truncation
Table 1: Cmax data from a parallel bioequivalence trial.

Table 2: Summary results of the bioequivalence study.

Table 3: The impact of significant digits of BE limit.

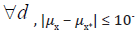
Suppose 𝑋 is a continuous random variable with standard deviation σ, and X* is its truncated value after rounding up to the 𝑑th decimal place with the same variance. We said X* is not statistically different from 𝑋 if we fail to reject the following null hypothesis at the 𝛼 level of significance

where 𝜇x and 𝜇x*are the population means of 𝑋 and X* , respectively. Meanwhile, when X and 𝑋* are not statistically distinguishable, the 𝑑th decimal places are considered significant digits we would like to keep. For all 𝑑, *X − X , the maximum possible error due to the truncation would be less than 10-d. As an example, for floating number 𝑎. 𝑏𝑐𝑒𝑓, if 𝑑 = 2, the smallest and largest values for a given number with two decimal places are 𝑎. 𝑏𝑐 and 𝑎. 𝑏(𝑐 + 1), respectively. Hence, the possible error is 0.00𝑒𝑓 or (0.01 − 0.00𝑒𝑓), which means that the maximum possible error must less than 0.01 = 10-2 = 10-d. Intuitively, to restrict the worst-case rounding error small enough so that the distortion of the distribution due to rounding error would be negligible. An idea of signal-noise in quality control and assurance is applied to compare this error with 𝑋’s standard deviation σ. The significant digits can then be chosen by taking the minimum 𝑑 digits such that

where 𝐶 is a constant, which is to be chosen such that the truncated observation in 𝑋∗ is not statistically different from 𝑋 at the 𝛼 level of significance. In practice, a convention choice of 𝐶 is 𝐶 = 10%. To provide a better understanding of the proposed procedure, the results for various choices of 𝐶 given 𝜎 is summarized in (Table 4). It can be seen that a smaller value of 𝐶 would require more decimal places to achieve the desired accuracy and precision, the same for 𝜎.
A Numerical Study
A numerical study is conducted to demonstrate the use of the proposed procedure. Thirty analytical results Xi,i=1,2,…..30 were generated from 𝑁 (𝜋, 0.012), which are given in (Table 5). For 𝐶 = 10%, we have

Thus, the minimum number of 𝑑 that satisfies the above expression is 𝑑 = 3. Therefore, the number of significant decimal digits is chosen to be 3. Now consider four data sets 𝑋ji, 𝑗 = 1,2,3,4, which are truncated at the 𝑗th decimal places of 𝑋i respectively. Then a paired 𝑡-test is performed in (Table 6) to test if 𝑋 1i, 𝑋2i, 𝑋3i are significantly different from the rest data sets, which shows that the rounding error could alter the distribution significantly. These results also prove that the proposed procedure works well because 𝑋3i is not significantly different from 𝑋4i. However, it should be noted that the conventional choice of 𝐶 may be conservative in this case, since 𝑋2i is also not significantly different from 𝑋3i and 𝑋4i. Therefore, we need to use different thresholds on different data instead of blindly using 10%
Table 4: Significant decimal digits for various selection of C given σ.

Table 5: Simulation data set for two-sample t-test.

Table 6: Pairwise comparisons.

Statistical Justification
Without loss of generality, suppose 𝑋 follows a normal distribution with mean 𝜇 and variance 𝜎2, i.e,
 By properly truncation, can still approximately normally distributed with mean 𝜇x* and variance 𝜎2, where 𝜇x∗ may be different from 𝜇x due to rounding error. Set
 considering that 𝑋 and 𝑋*are dependent, then under sample with 𝑛 subjects of the population, the following 𝑡-statistic can be used to test the null hypothesis 𝐻0: 𝜇x = 𝜇x* given in

where , and are sample standard deviation of 𝑋, 𝑋* and 𝑌 respectively. Meanwhile,
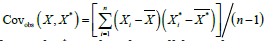 is the sample covariance of 𝑋 and 𝑋*. Under the null hypothesis, the paired 𝑡 statistic follows a 𝑡 distribution with 𝑛 − 1 degrees of freedom. Generally, we reject null hypothesis if
 where
where  ;is the (1 − 𝛼/2)th quantile for a 𝑡 distribution with 𝑛 − 1 degrees of freedom. Thus, under the alternative hypothesis 𝐻a: 𝜇x − 𝜇x*≠ 0, the 𝑡 statistic could be written as

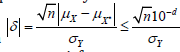
where 𝑡n-1(𝛿) denotes a non-central 𝑡 distribution with a non-centrality parameter

Obviously, 𝛿 = 0 under 𝐻0. On the other hand, since 𝑋* rounds to 𝑑th decimal places, the maximum possible error due to truncation would be less than 10-d and | 𝜇x − 𝜇x*| ≤ 10-d. Thus, a small value of  would guarantee that 𝑋* is not significantly different from 𝑋. Meanwhile, as |𝛿| decreases, the non-central 𝑡 distribution under the alternative hypothesis will get closer to the central 𝑡 distribution, which under the null hypothesis. Thus, as shown in the (Figure 1), if |𝛿| is small enough, the probability of correctly rejecting the null hypothesis, which is the power of the 𝑡-test, will be very low. Therefore, we want to find a boundary of 𝛿, i.e.


Based on the ratio of 𝜇/𝜎, confidence level 𝛼, and degree of freedom 𝑑𝑓, power could be calculated by

where 𝐹df, 𝛿(𝑡) is the CDF of non-central t distribution with non-central parameter 𝛿.
Accordingly, power would keep increasing as 𝛿 enlarges, and a proper limitation of 𝛿 could guarantee the power small enough under the alternative hypothesis. Thus, we could not reject 𝐻0 with a relatively high probability. (Table 7) demonstrate the relationship between non-central parameter, sample size, and power, which shows that the power would smaller than 10% when 𝜇/𝜎 = 0.1 and sample within 30 subjects. Therefore, for the constant 𝐶, generally given 𝐶 = 10%, we said X* is not significantly different from X when
Table 7: Relation between 𝑛, 𝛿 and power, by 𝜇/𝜎.
Table 8: The pass range and rounding error of significant digits.

At the same time, 𝑑 is the minimum decimal that could let the above inequation always holds. We know that
 , and then
 . Thus, 𝑑 should be the only number that can satisfy

After simplification, 𝑑 should be

The above argument could be applied similarly to a more general situation where a transformation is performed. Let 𝑓(𝑋) be the function of transformation of 𝑋, while 𝑓(𝑋) assumes normality. In this case, the hypothesis of interest becomes to

Therefore, under the null hypothesis, 𝑡f approximately follows a 𝑡 distribution with 𝑛 − 1 degrees of freedom and under alternative hypothesis, 𝑡f can be written as

where δ is still the same noncentrality parameter as defined in (2).
Meanwhile, if we choose the significant decimal digits property, we
could guarantee δ small enough, and the probability that X and X*
are statistically different small as well. In conclusion, the proposed
procedure works as well for data after transformation. Generally,
AUC (area under the plasma concentration-time curve) and Cmax
(time to achieve maximum concentration) in bioavailability and
bioequivalence studies skew to the right. As the result, log- transformation
is recommended. Thus, to illustrate the use of the proposed
procedure for transformed data, consider a log-transformation,
i.e., 

In this case, the proposed procedure is useful for the determination of the number of significant decimal digits to maintain a certain degree of accuracy and precision for the assessment of bioequivalence.
Application on BE study
In a bioequivalence study, suppose 𝑋T is a pivotal parameter of test drug with standard deviation 𝜎 and 𝑋 R is for reference drug with the same variance. If 𝑑th decimal places of BE limit is considered the significant digit we would like to keep, the confidence interval also needs to be rounded up with 𝑑th digits
For raw data of samples 𝑋T and 𝑋R, by two sample t-test of hypothesis testing H0:XT,XR are bioequivalent 𝑣𝑠 Ha:XT,XR are not bioequivalent.The confidence interval under 𝛼 confidence level of the difference of their population mean XT μ − XR μ is [𝐿, 𝑈] as follows


By conclusion in Section 5, when
 are not
significant different with [𝐿, 𝑈], where L* and U* are the truncated
value of 𝐿 and 𝑈, respectively.
are not
significant different with [𝐿, 𝑈], where L* and U* are the truncated
value of 𝐿 and 𝑈, respectively.
Therefore, for log-transformed data log 𝑋T and log 𝑋R in BE study, under the hypothesis


Thus, the significant digits of confidence interval could be determined by the methods as above. For untransformed data and log-transformed data, the significant digits should be the smallest 𝑑 that could reach [L*,U*] are not significant different with [𝐿, 𝑈]. In addition, for all 𝑑, the maximum rounding error due to the truncation would be less than 10-d. Meanwhile, the rounding error of confident interval after log-transformed would less than loge 10-d. (Table 8) shows the pass range of log-transformed data under BE limit with different significant digits.
Discussion
Statistical properties and justification of the proposed procedure of determining the number of significant digits in biomedical research such as bioequivalence and/or biosimilar studies were studied under the assumption of normality. In practice, other distributions such as Weibull distribution may be more appropriate to describe data collected from biomedical research such as dissolution study of the oral solid dosage form of a drug product. In this case, a similar concept could be applied to provide a valid statistical justification. In the descriptive analysis, the decimal places of descriptive statistics, such as mean, standard deviation, minimum, maximum, range, relative standard deviation (RSD), and the coefficient of variation (CV), and statistical inferences such as confidence intervals and p-values are always a concern, which is related to maintain the desired degree of accuracy and precision. In the interest of consistency, it is recommended that the same number of rounding numbers be used for descriptive statistics and statistical inferences derived from the analysis results. In some cases, the analytical results may be expressed in a scientific form (e.g., 1.32 × 10⁵ or 9.2 × 10⁻⁷) and the proposed procedure can be applied to its significant part (i.e., 1.32 for 1.32 × 10⁵ or 9.2 for 9.2 × 10⁻⁷) or its log (base 10) transformation.
When analytical results involving different datasets, it is suggested that each dataset keeps its own decimal digits determined by its standard deviation to maintain the same degree of accuracy and precision. A typical example is the assessment of dose proportionality in pharmacokinetic (PK) study. The purpose of a dose proportionality study is usually to show that there is a linear relationship between dose and AUC within a given range. In other words, doubled the dose, the AUC value is expected to be doubled. However, a high dose will generally produce a large variability in AUC values. As a result, low doses, median dose, and high dose are expected to have different numbers of decimal places to achieve the same degree of accuracy and precision. In the interest of keeping the same rounding numbers, we may consider the AUC values adjusted for dose and then apply the proposed procedure to determine the number of significant digits.
Acknowledgement
None.
Conflict of Interest
The authors have declared no conflict of interest.
References
- AMA (2020) AMA Manual of Style: A Guide for Authors and Editors A Guide for Authors and Editors. Oxford University Press, New York, USA.
- APA (2020) Publication manual of the American Psychological Association 7th (edn.), American Psychological Association, Washington DC, USA.
- Chow SC (2000) Significant digits in analytical research. Presented at Amgen, Inc, Thousand Oaks, CA.
- Chow SC and Liu JP (2008) Design and Analysis of Bioavailability and Bioequivalence Studies. 3rd (Edn.), Chapman and Hall/CRC Press, Taylor & Francis, New York.
- Chow SC, Song F, Bai H (2016) Analytical similarity assessment in biosimilar studies. AAPS J 18(3): 670-677.
- Daniel WW and Cross CL (2018) Biostatistics: a foundation for analysis in the health sciences. Wiley, New York, USA.
- FDA (2003) Guidance on Bioavailability and Bioequivalence Studies for Orally Administered Drug Products–General Considerations. Center for Drug Evaluation and Research (CDER), the US Food and Drug Administration, Rockville, USA.
- FDA (2006) Guidance for Industry: Bioequivalence Guidance. Center for Veterinary Medicine. U.S. Food and Drug Administration, Department of Health and Human Services, Rockville, USA.
-

This work is licensed under a Creative Commons Attribution-NonCommercial 4.0 International License.


