


 Review Article
Sample Size Matters: Newcomb-Benford’s Law and the Detection of Statistical Abnormalities in Research Data
Received Date: November 01, 2025; Published Date: November 17, 2025
Abstract
This study examines the applicability of Newcomb-Benford’s Law (NBL) in identifying abnormalities within reported and derived t-statistics from Economics and Finance research. NBL, which describes the logarithmic distribution of leading digits in many datasets, is a tool often used for fraud detection. However, its application faces challenges due to known exceptions and statistical tests prone to over-rejection with large sample sizes. I analyzed 180 articles from Australian Business Dean Council ranked journals, extracting relevant statistics. Initial tests confirmed the robustness of our method against heavy-tailed data. Overall, 12% of papers violated NBL for first digits, 28% for second digits, and 8% for last digits, with Finance journals showing more second and last digit violations than Economics. After correcting for the significant impact of sample size, firstdigit rejections increased to 27.22%, while second and last-digit rejections decreased to 5% and 2.78%, respectively. I found no overall disciplinary differences in violations, but lower-ranked journals exhibited fewer second-digit violations than higher-ranked ones. Factors like the number of authors and proprietary data showed some influence, but researcher h-index, institutional prestige, and prior retractions were not associated with NBL violations. These results highlight a notable presence of statistical abnormalities, particularly in first digits after sample size adjustments.
Keywords:Bedford’s law; statistical violations; sample size; fraud in research
Introduction
In 1881, scientist Simon Newcomb published an article stating that some pages of logarithm books were dirtier than others. Pages dealing with lower numbers were progressively cleaner to greater numbers. This is because, contrary to assumptions lower beginning numbers in various collections of data occur more frequently than higher ones. They do not follow the usual distribution [1]. The observation was formalized in 1938 by Frank Benford [2], To elaborate, Newcomb-Benford’s Law posits that the first significant digits in many datasets exhibit a specific logarithmic distribution. This means that lower digits, especially the digit 1, appear more frequently as the leading digit than higher digits like 9. In its most widely recognized form, which pertains specifically to the first significant decimal digits in base-10 numeral systems, Newcomb-Benford’s Law is often referred to as the First-Digit Phenomenon. It provides a mathematical framework that describes this tendency, encapsulated in a formula that quantifies the probability of each digit appearing in the first position:

For example, the probabilities of the numbers 1 and 2 in the first significant digit position are

For digits beyond the first significant digit, the law may be extended to:

Newcomb-Benford’s law has been in considerable use for empirical data for over a century and even in the modern era [3-9]. So prevalent is Newcomb-Benford’s Law that it has been proposed as a means of detection of fraud and abnormalities in the reporting of numbers in accounting [10,11] (Renaldo et al, 2022; Sastroredjo 2025), Medicine (Oman et al, 2024; Garcia-Sosa, 2024), and Economics (Tödter, 2009) amongst many others. In applying Newcomb-Benford’s Law to examine abnormalities in Economics and Finance research, (Tödter 2009) uses the first and second significant digits of regression coefficients and standard errors from 117 published articles. He tests for fit with Benford’s Law using two chi-square tests. He found violations of Benford’s Law in 25% of the papers. (Günnel and Tödter 2009) in examining a data set of Regression coefficients and standard errors of published research and forecasts, find that the economic research statistics conform to Newcomb-Benford’s Law, while the forecasts do not, with an excess of 1’s and 5’s.
Outside of Economics and Finance, (Eckhartt and Ruxton 2023) apply tests similar to (Tödter 2009) to two data sets of papers that were retracted and papers that were not retracted and published by “Royal Society Publishing”. They found that retracted articles were more likely to violate Newcomb-Benford’s Law. There are two problems with applying Newcomb-Benford’s Law in detecting abnormalities and potential fraud in experimental data. It is wellknown that many exceptions to Newcomb-Benford’s Law exist. Deckert et al., 2011, Gauvrit and Delahaye, 2011, and Goodman, 2016 all demonstrate that Benford’s Law is at best an approximation and departures from it can be considerable. Second, many of the statistical tests of Newcomb-Benford’s Law have over-rejection problems as the sample size becomes large. For example, the two Chi-squared tests applied on Economics papers by (Tödter 2009) suffer from over-rejection problems as the sample size grows larger (Kossovsky 2021).
Data
For data, I use the Australian Business Dean Council’s (ABDC) list of journal’s and randomly pick 1 journal that has articles available on the internet for download from the categories A* (Highest ranking), A (Next highest), and B ranked journals. C ranked journals were not included because the lack of online archives made randomization problematic. I did this separately for Economics and Finance, resulting in six journals selected. From each journal, I randomly selected 30 articles from the years 2024-2025 with t- or z-statistics or coefficients and standard errors sufficient to compute the statistics. To aid in recovery of this data, I used the application “Tabula” available at https://github.com/tabulapdf/tabula. Given that data was recovered from Acrobat.pdf files, not all available statistics were recoverable, though efforts were made to recover as much as possible. Only statistics in the main body were recovered. Statistics that were 0 were excluded. To test the appropriateness of using Newcomb-Benford’s Law on Financial data, I first take 100 portfolios sorted on Size and Value from Kenneth French’s website and run regressions on them in random pairs, saving the t-statistics on the independent variable in sample sizes of 130 for 10,000 replications. Table 1 shows the resulting figures.
As can be seen in Table 1, the Euclidian distance test statistic under-rejects the resulting t-statistics from the regressions of the underlying hyper-kurtopic data, showing the test is resistance to distributions with heavy tails. The overall percentage of violations for the first significant digit is 12%, for the second significant digit, 28%, and for the randomness of the last digit, 8%. Of the Economics journals, Economics A has the greatest percentage of violations in each test. Of the Finance journals, journal A* has the greatest percentage of violations in each test. While the Economics and Finance journals have comparable percentages of first digit violations, the Finance journals as a group, exhibit a greater percentage of second significant digit violations (Z-stat=2.2291, prob.=0.02574) and a greater percentage of rejections of randomness in the last digit (Z-stat=2.4727, prob.=0.01352). In grouping the journal articles by ABDC ranks, the results strikingly show little difference between the rankings in terms of test rejections. The difference in last digit randomness between B rank journals and other ranks is not statistically significant (Z-stat=1.124, prob.=0.2627).
This could be taken as demonstrating that either data that violate Newcomb-Benford’s Law and digit randomness are evenly distributed in use across ranks or that intentional abnormal numbering is evenly distributed (Figures 1&2) (Table 2). To further test the effect of paper-related factors on rejections statistics, I gathered the following information on each paper: Nauth; the number of authors, to test whether there are agency problems in conducting research so that larger teams have more trouble coordinating quality issues or lone individuals; Size, the number of data points for each paper, to see if the sample size effects rejection, as postulated by [12-17]; and Ln(size), the natural log of size, to test for non-linear effects of sample size on rejection probabilities, again as per. I also check for the use of proprietary data (Propr.) and whether publishing authors have ever had a publication retracted before, using Retraction Watch (Retract) from https://retractionwatch.com/. I also track researcher quality by using the average h-index of the paper researchers (Havg), and I check for pressure to research by measuring the “prestige” of their institutions by searching for the number of links in Google Scholar, and average them for each paper (Iavg) (Table 3).
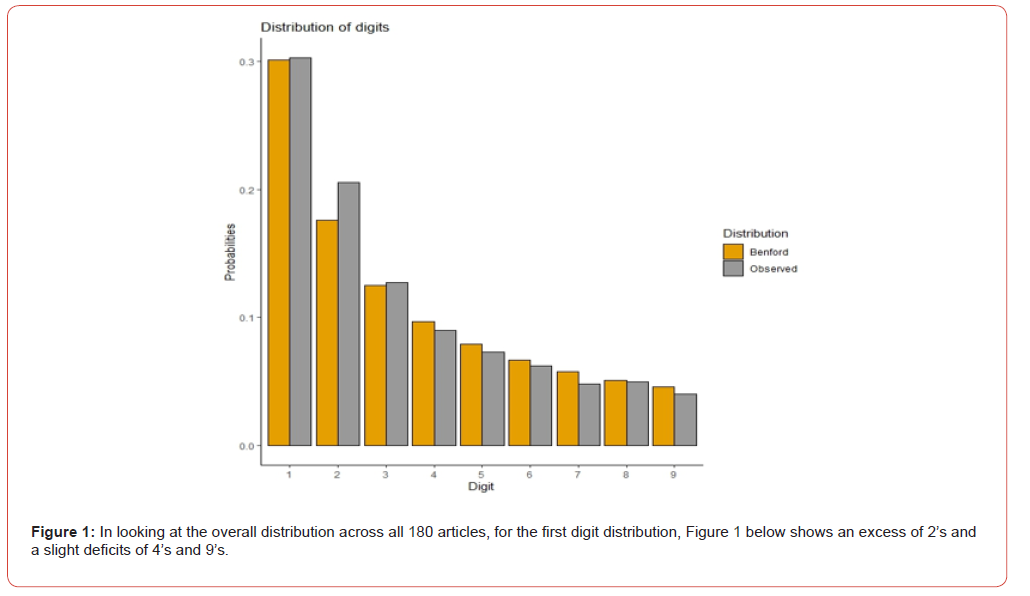
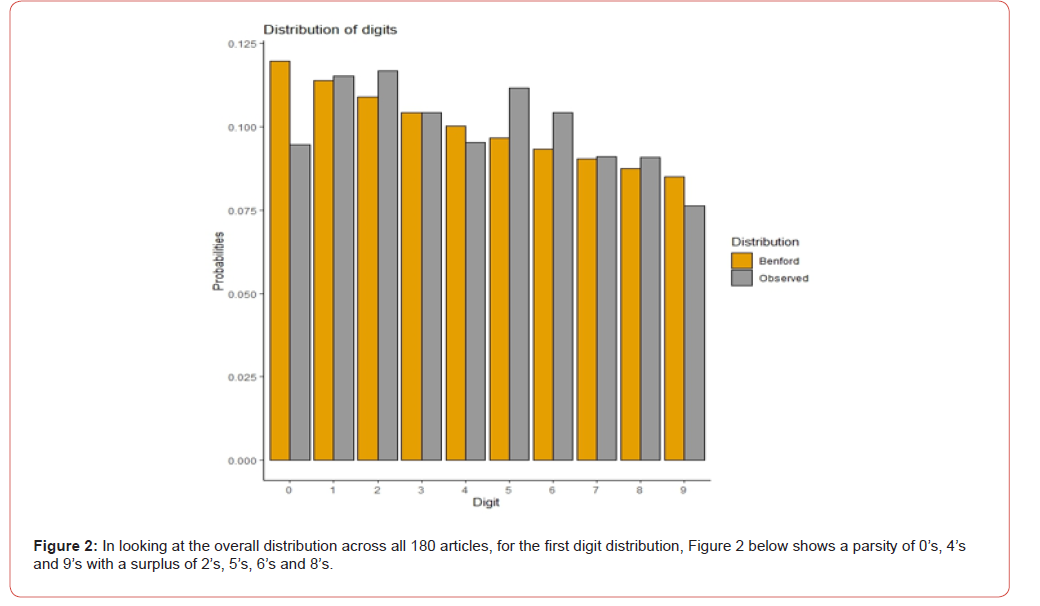
Table 1:As can be seen in Table 1, the Euclidian distance test statistic under-rejects the resulting t-statistics from the regressions of the underlying hyper-kurtopic data, showing the test is resistance to distributions with heavy tails.

Table 2:Journal Results.

Table 3:Descriptive Statistics

As the table shows, the average paper in the sample has 127.35 data points, with 2.79 authors, with a 35.96% chance of using proprietary data. The authors have an average h-index of 7.11 with their institutions having average Google Scholar links of e12.55885or 293,168. The results show that there is a small, but significant, size effect towards with rejection, with the probability of rejection getting greater as the sample size gets larger, but except for the 1st digit results, there are no non-linear effects in the effect of size on rejection. For the 1st Digit results, as size grows, there is a non-linear positive effect that makes rejection less likely. However, this is only for the 1st digit tests, which brings into question the results. The number of authors is found to increase the probability of rejection for the 1st Digit results, indicating that more authors may lead to agency-like problems in constructing research. However, this result is not supported for the other digits. Similarly, for the 2nd digit results, the use of Proprietary data is found to increase the probability of rejection for 2nd Digit results (Table 4).
Table 4:Regression Estimates on Effects of Rejections.

The table reports Censored Regression results using an Extreme Value Distribution. Standard errors are reported in parentheses. ***, **, * indicate significance at the 1%, 5%, and 10 % levels respectively.
Table 5:Journal Results After Size Effect Correction.

The Havg and Iavg variables are statistically insignificant, indicating the effects of peer and institutional pressures are non-existent. After correcting for the effects of size on the 2nd digit and last digit tests, the number of rejections overall declines, but the overall patterns remain. however, for the 1st Digit results, the number of rejections increase because of the non-linear effects. It is interesting that the total sample of rejections for both the 2nd and last Digit tests fall at or below the 5% rejection rate adopted, perhaps indicating that the results support no indication of abnormalities. But the 1st Digit results support increased presence of abnormalities, once sample size effects are corrected for. The difference in the proportion of 2nd- Digit rejects between Economic journals (7.78%) and Finance journals (2.22%) is statistically significant at the 8.726% (Z-stat=1.7113). The difference in proportions between B journals and A and A* journals for the percentage of rejections on the 2nd’ Digit is statistically significant at the 4.236% level versus A* journals (Z-stat=2.0347) and the 2.26% level versus A journals (Z-stat=2.2837) (Table 5).
Conclusions
The results indicate, that even when using methods that have proven resistant to heavy tails and samples sizes in previous work, reported and derived t-statistics from Economics and Finance research papers still exhibit distributions of 1st, 2nd, and last digits that are significantly influenced by sample size. After correcting for the average sample size effect, I find that 27.22% of the papers exhibit 1st Digit distributions that are abnormal compared to the Newcomb-Benford distribution, 5% for 2nd Digit Distributions and 2.78% for the randomness of the last digit. I do not find any differences in violations between disciplines. I do find a difference in violations of 2nd digit’s between ABCD journal classifications, with lower classifications having fewer violations than higher classifications. I do not find that previous retractions are associated with violations.
References
- Newcomb S (1881) Note on the frequency of use of the different digits in natural numbers. American Journal of Mathematics 4(1): 39-40.
- Benford F (1938) The law of anomalous numbers. Proceedings of the American Philosophical Society 78(4): 551-572.
- Hickman MJ, Rice SK (2010) Digital analysis of crime statistics: Does crime conform to Benford’s law? Journal of Quantitative Criminology 26: 333-349.
- Sambridge M, Tkalčić H, Arroucau P (2011) Benford’s law of first digits: from mathematical curiosity to change detector. Asia Pacific Mathematics Newsletter 1(4): 1-6.
- Mir TA (2014) The Benford law behavior of the religious activity data. Physica A: statistical mechanics and its applications 408: 1-9.
- Alexopoulos T, Leontsinis S (2014) Benford’s law in astronomy. Journal of Astrophysics and Astronomy 35: 639-648.
- Golbeck J (2015) Benford’s law applies to online social networks. PloS one 10(8): e0135169.
- Tošić A, Vičič J (2021) Use of Benford's law on academic publishing networks. Journal of Informetric 15(3): 101163.
- Fernandes P, Ciardhuáin SÓ, Antunes M (2024) Unveiling Malicious Network Flows Using Benford’s Law. Mathematics 12(15): 2299.
- Rad M, Amiri A, Ranjbar MH, Salari H, McMillan D (2021) Predictability of financial statements fraud-risk using Benford’s Law. Cogent Economics & Finance 9(1): 1889756.
- Nigrini MJ (2019) The patterns of the numbers used in occupational fraud schemes. Managerial Auditing Journal 34(5): 606-626.
- Blondeau da silva S (2020) Limits of Benford’s law in experimental field. International Journal of Applied Mathematics 33(4): 685-695.
- Crutcher HL (1975) A note on the possible misuse of the Kolmogorov-Smirnov test. Journal of Applied Meteorology and Climatology 14(8): 1600-1603.
- Dahiru T, Dikko HG (2013) Digit preference in Nigerian censuses data of 1991 and 2006. Epidemiology Biostatistics and Public Health 10(2).
- Hayes SJ (2008) Terminal digit preference occurs in pathology reporting irrespective of patient management implication. J Clin Pathol 61(9): 1071-1072.
- W Hurlimann (2003) A generalized Benford law and its application. Advances and Applications in Statistics 3(3): 217-228.
- Simohnsohn U (2019) Number-Bunching: A New Tool for Forensic Data Analysis.
-

This work is licensed under a Creative Commons Attribution-NonCommercial 4.0 International License.