


 Review Article
Population Projection and Adjustment Methodologies for Household Sample Surveys: an Overview of Methodology
Received Date: August 28, 2018; Published Date: September 21, 2018
Abstract
Population projections are essential for updating the population information which will be used as the ideal sampling frame for many surveys such as health, agriculture and many others. The techniques used to make population projections can be classified as mathematical models and cohort component projection models. Mathematical models are useful when we only need to project the total and domain populations. Therefore, they use total population figures from the past to project future population levels. Among the possible alternative curve fitting methods like linear, geometric, logistic and exponential, the most widely used mathematical model for population projections is exponential model.
Keywords: Projection techniques; Household surveys; Probability selection methods
Introduction
For the future population, there are two types of estimation techniques: Intercensal estimate (between two censuses) and Postcensal estimate (immediate). Intercensal estimates are referred as interpolation and postcensal estimates are referred as extrapolation. Estimates and projections can be on the basis of either de jure (usual resident) or de facto (physically present) enumeration basis for populations. In most cases, they are based on de facto population basis. Population estimates based on projections will provide latest population size values. Unbiased sample selections and representative estimates can only be achieved through this selection processes.
Overview of Population Projection Techniques
The techniques used to make population projections can be classified under two categories: mathematical or trend models and cohort component projection models.
Mathematical models are useful when we only need to project the total population. Therefore, they use total population figures from the past to project future population levels. Among the possible alternative curve fitting methods like linear, geometric, exponential, and logistic, the most widely used mathematical model for populations is exponential.
Cohort Component Models are more data intensive because they disaggregate total population figures into age/gender “cohorts”. Further, the different “components” of population change (births, deaths, and migration) are considered and past figures for these components are applied to the current age/sex cohorts. The cohort component method is grounded in the basic demographic equation because there are three ways that a population can change in size and composition: births, deaths, and migration. Basically, the cohort component method survives each age-sex population subgroup at a certain time 1 forward to time 2, adds in the new births and in-migrants, and subtracts out-migrants.

Nt Projected population after t years
N0 Initial population
B Births that occurred during the time interval
D Deaths that occurred during the time interval B-D Natural IncreaseIM Immigration/In-migration during the time interval OM Emigration/Out-migration during the time interval IM-OM Net migration
Clearly, to obtain more precise and more detailed information about a current and future population, the inclusion of age in the projection techniques is a necessary addition.
Mathematical models
Linear models
The linear model of the following form is used for the population projections.

Nt Projected population after t years
N0 Initial population
Nn End-of-period population
t Years since p0 to the year of the estimate
n Years between the initial and end-of-period populations
The same result may be obtained by drawing a graph with a straight line through N0 and Nn and reading off any intermediate or later value.
Geometric models
Geometric growth means that each year the population grows with the same growth rate, that is, the population grows according to a constant growth rate and it thus compounds once in a year.
The idea of so-called tipping points is that it makes concrete the Hawking notion of irreversibility.

t Years since N0 to the year of the estimate
r Annual growth rate
N0 Initial population
Nt Projected population after t years
Thus, a geometrically growing population shows each year a different amount of absolute change whereas the rate of change is constant for each year [2].
Logistic growth model
The fitting of a logistic growth model which follows an S-shaped curve overcomes the problem of an undefined and extremely large population projection. The logistic curve implies that at some point in time an upper limit to the ultimate population size will be reached and that eventually a stationary population situation emerges [2]. The logistic curve corresponds with the historical course of population growth during the demographic transition (an initial period of slow growth, followed by a phase of rapid growth (due to falling death rates) and finally a plateau in population numbers arising from low birth rates [1].

Nt Projected population after t years
N0 Initial population
r Growth rate
n Years between the initial and end-of-period populations
Exponential models
In reality, people are being born all the time, and they are dying all the time. Thus, the population growth rate is a continuous process rather than a single annual increment or like the interest on a bank deposit being paid once a year [3]. For a continuously increasing population, we describe an exponential growth:

t Years since N0 to the year of the estimate
r Growth rate
N0 Initial population
NtProjected population after t years
e2.71828 (Constant for the natural algorithm)
It is a fact that the growth rates change over time and are not constant. However, all of the above models imply that populations will ultimately grow to an undefined large number of persons. The models do not allow a levelling off population growth or declining population size [2]. All the above mathematical models can be used to prepare intercensal and postcensal estimates.
Exponential Model for Population Projectiont
In order to use the exponential model for the population projections, it is essential to obtain and use annual population growth rates. In practice, the recent past population growth rates are determined from the two latest population censuses (if available) for the related domains. For simplicity, we can call these as data source (k) and (k+1). The previous annual population growth rates for the corresponding domains can be obtained by using the population counts of the available data sources. Using the same domain dimensions, the future projected population can be labelled as data source (k+2), for convenience. Generally, the related population domains (or strata) will correspond to the segregated class boundaries in survey sampling methodology. The following Table 1, which illustrates the relationship among domains.
Table 1: Graphical illustration of data sources and population structures [4].

The population domains are evaluated as statistical regions which are based on EUROSTAT’s “Nomenclature of Statistical Territorial Units” (NUTS) classification. The overall population size (N) is equal to the sum of domain populations.

The following form of the exponential growth model is used for population projection of domains. For some designs, population domains may correspond to population strata [4].

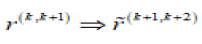
The estimated annual rate of past population growth can be obtained by,
Otherwise there is no special reason, the past annual growth rate of the population may be used also as a future population growth rate. That is,

Taking the future domain growth rate as, the future population growth of the domains can be projected using the following model. The total population projection can be obtained as;

Proposed Population Adjustment Methodology
Information provided for data sources (k) and (k+1) corresponds to the two previous population census results of the related domains. Therefore, domain totals and overall total information will be identical. On the other hand, information which is based on population projections for data source (k+2), will not have the same desired properties. In other words, the sum of domains will be equal to the existing domain total, but this will not be equal to the total projection estimate of the overall population. In order to balance the relationship between the domain totals and the overall total, an adjustment is required. This can be called as the total population projection adjustment. This adjustment will correct the difference between the sum of the projected domain populations and total population projections [4].
The sum of domain populations will be equal to the existing
domain total of but this will not be equal to the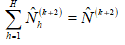 total projection estimate of the overall population. That is

assuming that,
In order to balance the relationship between the domain totals and the overall total, an adjustment is required. This can be called as the “total population projection adjustment”. Ünalan and Ayhan had proposed this adjustment for correcting the difference between the “sum of the projected domain populations” and “total population projections” [4].
That is,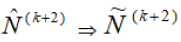
Let us show the difference between the above total projections as;

Then the sum of the adjusted projection totals for domains will be equal to

Consequently, the projected domain totals become identical to the total population projections.
Conclusion
This paper gives a brief review of the current methods including cohort component projection models and mathematical models for the population projection and also point out that some adjustments are needed to avoid the representation bias of the selected sample for a given survey. The methods are clearly illustrated, and the appropriate conclusions are drawn for each method.
Rather than updated population projections, the use of the latest population counts is very common in developing countries. These figures are creating under-coverage error, and serious bias for population representation.
The earlier computations based on census data reflects the population under-coverage error when compared to results which are based on latest adjusted methodologies.
This study reflected the results of the importance of the updated population counts as the basis for representative sample selection. Some sample surveys may use the existing latest population values, which may be outdated. Ideally, updated population values must be used to avoid the representation bias of the selected sample for a given survey. The representation issues are discussed in more detail by Ünalan and Ayhan [4].
References
- Rowland DT (2003) Demographic methods and concepts, Oxford University Press, UK.
- Groenewold G, Navaneetham K (1998) The projection of populations: data appraisal basic methods and applications. center for development studies and UN population fund, Kerala.
- Hinde A (1998) Demographic methods. Arnold publishers, London, UK.
- Unalan T, Ayhan HO (2013) Probability sample selection method in household surveys when current data on regional population is unavailable. Statistics in transition 14(2): 217-230.
-

This work is licensed under a Creative Commons Attribution-NonCommercial 4.0 International License.


