 Research Article
Patient-Oriented Cohort System to Educate and Encourage Clinical Communications
Brett Harnett*, Daniel P Schauer, Mark H. Eckman, Pete Baker and Robert Ireton
University of Cincinnati, Department of Surgery and Internal Medicine, USA
Brett Harnett, Department of Surgery and Internal Medicine, MS-IS, University of Cincinnati, 231 Albert Sabin Way, ML 0840, Cincinnati, OH 45267, USA. .
Received Date: October 02, 2019; Published Date: October 23, 2019
Abstract
According to the Pew Research Center, 72% of internet users say they looked online for health information within the past year. The most commonly-researched topics are specific diseases or conditions, treatments or procedures and doctors or other health professionals. Clearly, patients are interested in learning about health issues and seek various sources to gain knowledge. Yet when it comes to patients and their doctors, the paternalistic relationship tends to squelch bidirectional communications. We hypothesized that if a patient was given information about other patients similar to them, the shared knowledge would promote enhanced communications behind the closed doors.
Keywords: Patient centered; Patient-physician relationship; Communications; Information systems
Take-Away-Points
The patient centered movement must drive a culture change that involves both providers and patients to be fully effective. To better engage the patient side of the equation, patients themselves need data in a format that can be easily digested and understood. Tools such as the Patient Centered Medical Zone could set an example for how to present data that helps to engage patients in their own health and care. Such tools should:
• Provide data about the patient that is interesting
• Provide an easy to understand interface or presentation layer
• Engage the patient so they feel empowered
• Create an environment where patients are encouraged to open dialog
Structured Abstract
Objectives
To determine if patients would become activated and more engaged in their own healtand ask more questions of their physicians if they were provided their data and data about patients similar to themselves.
Study design
An interventional pilot study conducted with 150 patients and three physicians. The study was executed from September through November 2013.
Methods
We developed a software interface for patients, populated by data from the enterprise electronic health record to create individual patient cohorts matched on clinical and demographic data. Patients used this information to learn about clinical issues relevant to patients like themselves. Subjects were allowed to manipulate the interface to obtain greater sensitivity or specificity in the degree of similarity between the cohort and themselves. Feedback was garnered through surveys.
Results
Patients reported increased communication with their physicians as a result of tool use. However, the physician component of these dyads did not report the same increase in communication. Overall, patients were engaged in using the tool but the feedback from the physicians noted no change.
Conclusion
The system was able to deliver acceptable cohort lists and patients were engaged at that level. Providing usable, digested data in a format patients can understand could be a useful method in further engagement. Patients and physicians in the study believe this type of tool could be useful, but modifications and further study is needed.
Introduction
Patients are interested in information about health issues and seek various sources to gain knowledge. According to the Pew Research Center, 72% of computer users said they searched the internet for health information within the past year; most commonly for information about specific diseases or conditions, treatments or procedures, and doctors or other health professionals. Yet when it comes to patients and their physicians, the often paternalistic nature of these relationships tends to inhibit bidirectional communications [1].
The patient-centered care concept encourages increased patient involvement in their own healthcare. Federal legislation such as the Affordable Care Act of 2010 is beginning to change the outdated fee-for-service model towards one focused on population wellness and value; better health theoretically lowers cost. Encouraging people to be more engaged in the personal management of their health is a cornerstone of the patient-centered medical home. In fact, National Committee for Quality Assurance (NCQA) guidelines encourage better physician – patient communication. This presents a new opportunity and challenge for health information technology and for tools that can facilitate shared decision-making, improved patient–clinician communication, and access to medical information by patients.
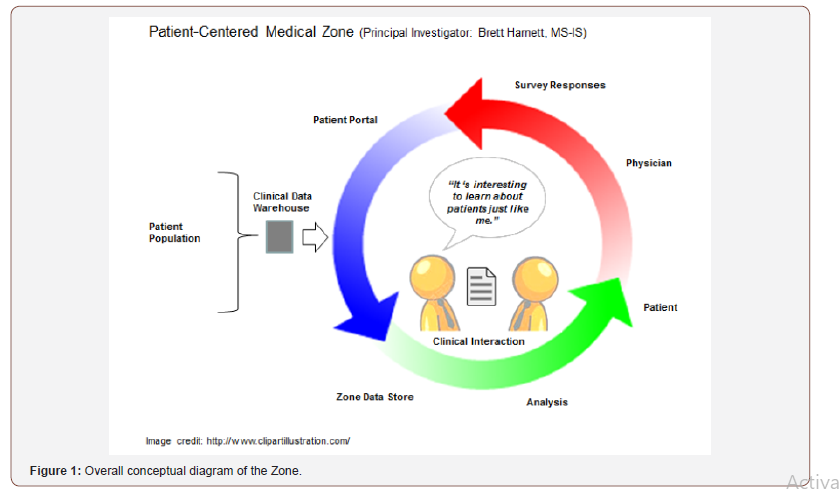
The recommendation for improved communication between the physician and patient implies the need for dialog rather than unilateral communication. Patients need to be proactive in discussions with their physicians, but this will not happen without a culture change and tools to encourage and support patient activation and dialog. This study involved the development and evaluated the usability of a software application and the feasibility of using this tool in an ambulatory clinical environment. The tool itself was designed to provide patients with information about (more or less) similar patients using data pulled from the institutional electronic health record (EHR) and displayed for patients in a structured format. By sharing information about patients like themselves, we hoped to encourage patients to participate in more active discussions about their own medical problems (Figure 1). We hypothesized that if a patient was given information about similar patients the relatable knowledge would promote enhanced communications behind the closed doors of the clinical encounter (Figure 1) [2].
 \
\Methods
Study setting and enrollment
The study was conducted in one of the University of Cincinnati/ UC Health Primary Care Network between September 11, 2013 and November 15, 2013 and approved by the University of Cincinnati Institutional Review Board June 7, 2013. Informed consent of study subjects was obtained as required. Subjects were selected based on inclusion criteria consisting of ICD-9 codes of 401.x, 402.x, 403.x or 404.x, age 21 years or older, English speaking and willing and able to give consent. Excluded were those with a history of the following conditions: psychosis, mania, hypomania, severe cognitive impairment, current suicide risk, reported thoughts of violence.
System design
To accomplish the aims of the study, we developed a customized subsystem called the Patient Centered Medical Zone – or the “Zone” for short (Figure 1). It was made very clear to all stakeholders that the purpose of this study was to educate patients about other patients similar to them so they could understand options and have a different learning perspective about their own healthcare. Our goal was not to alter current therapeutic decisions or medical management, rather to provide information to patients that might open additional conversations with their physicians [3].
As a pilot study, we limited our intervention to a single common disease, hypertension. Hypertension was chosen since it is a common condition permitting the ability to generate robust and reasonably sized cohorts of matched patients. Since hypertension has numerous treatment options, it was considered a good choice for our study given the many opportunities it presents to discuss treatment and lifestyle modifications.
To enhance the level of engagement, the Zone was designed for interactive input to get the attention of the subjects. The primary tool was the screen designed for subject views - the Zone user interface presented on a laptop computer based on the design constraints. After primary care providers were identified and enrolled, we queried and extracted a patient dataset from the University of Cincinnati Medical Center’s Epic data store based on a query identifying patients with a diagnosis of hypertension (ICD-9 codes 401) who were active patients under the care of any of the three enrolled physicians. These data were then migrated to the Zone subsystem [4].
To supply each patient with information about other patients most similar to themselves, the Zone interface organized data and then presented it through views that support a dynamic interaction with the data. Information describing similar patients included demographics (age, gender, and race), clinical data (Body Mass Index [BMI], blood pressure, medication allergies, and smoking status) and medications for the treatment of hypertension and comorbid conditions. To allow the subjects to have a comparison indicator, we noted whether blood pressure was rising, falling or unchanged since the previous clinical reading.
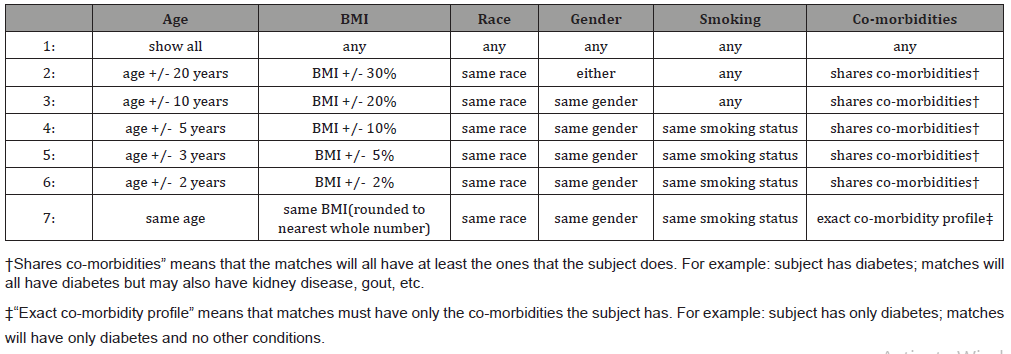
Seven parameters were used for the matching algorithms: gender, race, age, co-morbidities, smoking status, BMI and allergy to angiotensin converting enzyme (ACE) Inhibitors. We felt these were the most relevant parameters upon which to match patients with a primary diagnosis of hypertension. The algorithms used to create matches of either greater sensitivity (more patients) or greater specificity (fewer patients) are shown in Table 1. Higher values in the table indicate a more specific match (Table 1) [5].
Table 1: Parameters.

Pilot evaluation
The Zone followed a simple but strict protocol. Because the process (consent and cohort review) took about 30 minutes, the clinical coordinator contacted the potential enrollees the day before their previously scheduled appointment. Subjects were paid $30 to arrive 30 minutes prior to their appointment time, when the patient arrived the clinical coordinator explained the study in more detail. If consented, the coordinator found the subject’s record in the Zone subsystem. The coordinator and the subject then sat together in private and reviewed the data [6].
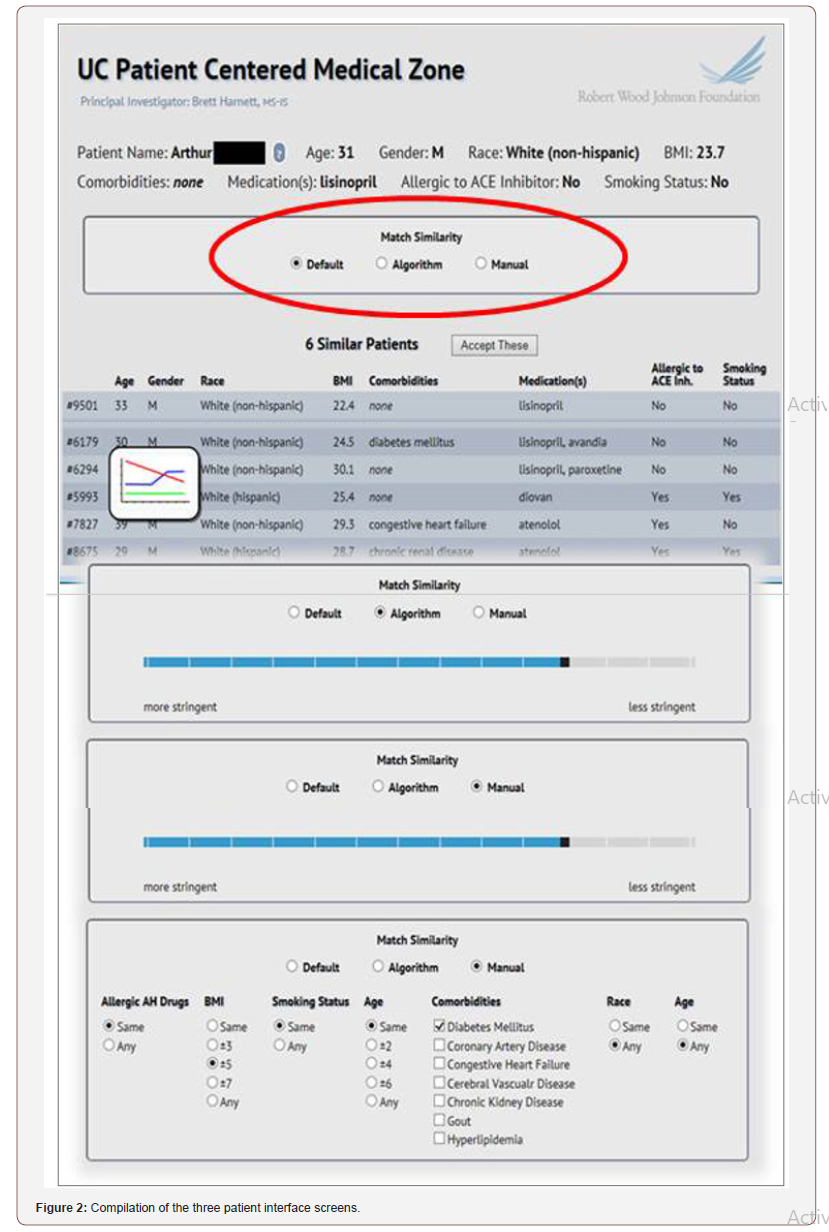
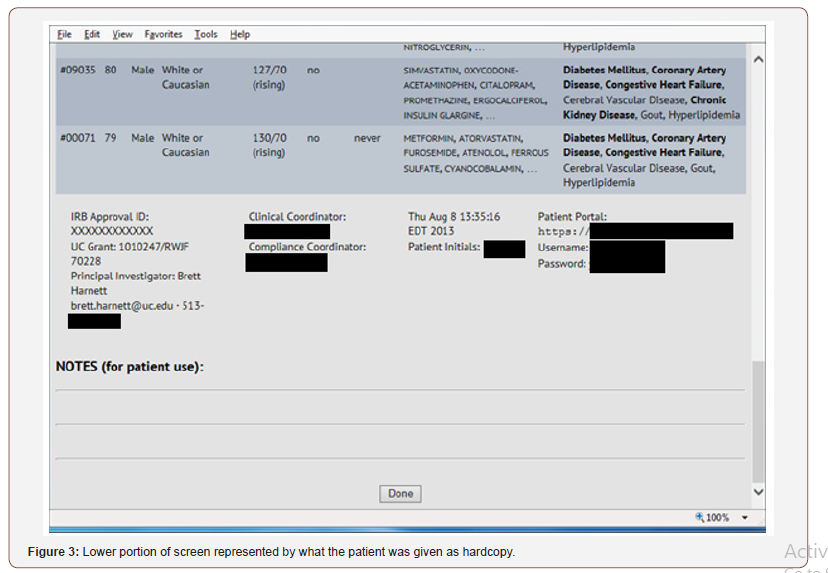
The Zone was designed to allow the user to select a cohort of similar patients using three different approaches depending upon user preference. The initial screen was the standard/default list, a second was a slider/algorithm scale and the third was a manual manipulation of the seven parameters. Subjects had the option to browse one, two or even all three methods to select the matches they felt were most similar (see composite Figure 2). The system captured which mode was ultimately selected. The standard default selection was a calculation to generate a default list of similar patients. The slider algorithm was based on the default list, but the patient or study coordinator could either increase the sensitivity (slide left) or increase the specificity (slide right) returning more or fewer matches. The system dynamically changed the number of matches based on predetermined weightings. The third method was a manual selection/de-selection of parameters. Once the final cohort of most similar patients was determined, a list of the top six (plus or minus 3) was printed and given to the subject prior to their physician visit (see Figure 3). The report also contained brief instructions for how the patient could log into the secure Zone website if they desired to review this information at a later time (Figure 2 & 3).

 \
\To minimize bias, physician participants were told to not encourage dialog based on the “cohort print sheet” the patients carried into the exam room, leaving the onus on the patient to begin this dialog.
When the patient emerged from the examination room, the coordinator approached the subject and asked eight survey questions described in results section. The survey was designed to capture the level of engagement by the subjects.
In addition to the formalized patient survey, the participating physicians were interviewed by the Principal Investigator at the end of the study in a less formal open discussion to get their overall impressions.
Data review
The survey items and demographic and clinical variables were assessed using analysis of variance and Fisher’s 2 x k exact test for the remaining items (see Table 2), which were treated as binary since the number of “not sure” responses were negligible (Table 2).
Table 2: Survey Stratification Results (P-Values).

Result
Over the course of nine weeks we enrolled 150 patients while 21 declined. The system accomplished the goals by delivering cohorts that reflected the subjects’ demographic and clinical parameters. The interface allowed the subject to be involved in the process of selecting a similar cohort with the three options. The default option used predesigned elements to weight the variables. The second option was a slider mechanism that “tightened” or “loosened” the criteria matching and a third option was manual selection of the parameters. The interface performed properly during all subject sessions.
Categorically, a significant majority selected the slider/algorithm and the manual mode. A small percentage of the subjects opted for the first/default mode. Default: 13, Slider: 70, Manual: 67; n=150.
Regarding system engagement, the survey data indicated the patient cohort presented in the Zone was similar to them (67%), the system was easy to understand (95%) and the system was not overwhelming (93%). Therefore, the system accomplished technical goals by delivering cohorts that reflected the subjects’ demographic and clinical parameters.
While almost half indicated they initiated more dialog (47%) and believed their doctors were responsive, two observations are worth noting; first, this was a pilot study without a control group, so we cannot attribute use of the Zone to increased patient-physician dialog. Second and contrary to many patients’ perceptions, in follow-up discussions with the participating physicians, they reported that patients did not ask more questions than normal. This could imply that while data about similar patients was interesting, the data supplied was not engaging enough to encourage greater patient-initiated dialog about their own health. These results are provocative but inconclusive.
More broadly speaking, a smaller percentage of subjects thought being compared to larger group would be beneficial (36%) and a large majority thought a tool such as this could improve patient care (71%).
Looking for trends or stratifications, no survey response group was significantly correlated with patient age, race, gender, current smoking status, diabetes or allergy to hypertensive medication. We note that the available sample of subjects affords >80% power to detect moderate true associations (i.e., linear correlations >|0.25|), so this uniform lack of significance cannot be attributed to inadequate sample size.
The data suggest that patient responses are largely consistent across demographic and clinical groups. There were a small number of “don’t know” entries that were treated as missing data because these were too few to be used as a separate response category.
The post-project survey of the three enrolled physicians consisted of an unstructured discussion about patient observations. The predominant theme was that patients were not any more engaged than normal. While the physicians hoped the study participants would refer to the printed output and ask different types of questions, in general they did not. The physicians also observed that some of the subjects really didn’t know how the information was to be used; suggesting the rationale of the Zone process itself was not well understood.
Contrary to almost half of the subjects the physicians in the study did not believe that the Zone prompted patients to open a dialog. However, they thought that this type of information might help stimulate communication and enhance patient-centered care if approached differently. For example, in many cases the patients were more focused on the reason for the visit, e.g. the chief complaint was back pain but the data presented was about hypertension. The patients were there to discuss back pain, not high blood pressure. If information presented by the Zone reflected the reason for the visit as opposed to a chronic condition, it might be more relevant to the conversation and better embraced.
Discussion
Patients want information about their medical conditions; however, the words, pictures and video consumed by patients over various mediums can be misconstrued or inaccurate. Unlike countless websites that create disease-specific chat rooms, message boards and blogs, the Patient-Centered Medical Zone used real clinical data (de-identified) from our own electronic health record to share with subjects.
While there are various domains dedicated to patient engagement, there are many methodologies to encourage better communications. There are a few studies that reference sharing information but not beyond their own data. Presenting one’s health metrics juxtaposed to similar patients could open new doors to patient engagement.
The study demonstrated merit in certain areas but the determination of enhanced communication was inconclusive. The subjects largely indicated the tool itself was usable and informative and many in fact believed they experienced more dialog. After the analysis and physician interviews it became apparent that patient and physician perceptions about their interactions were not the same. While there were only three physician subjects in the study, their collective opinion indicated no marked improvement in the patient encounter. Despite this corollary we believe the concept of supplying accurate data about similar patient compared to them, patients could benefit and become more engaged in their care.
There were numerous challenges encountered throughout the study. The primary hurdle we faced was clinic workflow. While the interface was designed to deliver results quickly, the logistics of engaging the patient, explaining, consenting and the software interaction itself proved to lengthy with regard to contemporary waiting room “wait times”. If a system such as this was to scale, some type of kiosk, portable tablet or even an app would be needed to provide a highly intuitive, quick self-service mode.
The physicians largely believed this type of process could enhance patient-centered healthcare. However, a better way to present the concept is probably needed. The fact that 91% of the subjects went beyond the default selection mode indicates interest in this type of information. We infer too much effort was put into the cohort design tools and not enough in the application of the data in patient context.
Perhaps a different approach is needed to better engage our patients. Furthermore, of 150 enrolled patients, none (zero) logged into the Zone web site post visit. While this study did not seek to identify how many had the ability to use the internet, we had assumed that a significant percentage did. It is interesting that none of the subjects took the extra time to review their cohort comparisons with family members.
Analysis of the patient/subjects to look for trends in responses based on demographic and clinical attribute showed little correlation across any parameter. This implies that levels of engagement were homogeneous across the patient population and suggests the concept and design would be embraced or rejected across demographic lines.
We surmise a different approach in terms of how the data is presented to the patient is needed such as comparison on a larger scale and indexing where amongst the broader population, a patient is rated in terms of trending of blood pressure control. This may provoke a higher level of interest in one’s personal health and how to improve.
Conclusion
The system was able to deliver acceptable cohort lists and patients were engaged at that level. Providing usable, digested data in a format patients can understand could be a useful method in further engagement. Patients and physicians in the study believe this type of tool could be useful, but modifications and further study is needed.
Authorship Information
Concept and design (BH); acquisition of data (PB); analysis and interpretation of data (PB); system development (RI); drafting of the manuscript (BH); critical revision of the manuscript for important intellectual content (ME, DS, PB, RI); statistical analysis (ME); provision of study materials or patients (DS); obtaining funding (BH); administrative, technical and logistic support (BH).
Acknowledgements
Author Affiliations: University of Cincinnati, Department of Surgery and Internal Medicine.
Funding Source
This study was funded by a grant from the Robert Wood Johnson Foundation and supported by an institutional Clinical and Translational Science Award, NIH/NCATS Grant Number 8UL1TR000077-05 (Center for Clinical and Translational Science and Training (CCTST)).
Author Disclosures
The authors report no relationship or financial interest with any entity that would pose a conflict of interest with the subject matter of this article.
References
- Health Fact Sheet (2014) http://www.pewinternet.org/fact-sheets/health-fact-sheet.
- Lazarus AJ (2013) Can we talk? The search for common ground in the doctor-patient relationship. Med Pract Manage 29(3): 152-156.
- Rittenhouse DR, Shortell, SM (2009) The Patient-Centered Medical Home - Will It Stand the Test of Health Reform? JAMA 301(19): 2038-2040.
- NCQA Patient-Centered Medical Home. http://www.ncqa.org/portals/0/PCMH%20brochure-web.pdf October 3, 2014.
- Diaz JA, Griffith RA, Ng JJ, Reinert SE, Friedmann PD, et al. (2002) Patients' Use of the Internet for Medical Information. J Gen Intern Med. 17(3): 180-185.
- Baird A, Nowak S (2014) Why primary care practices should become digital health information hubs for their patients. BMC Fam Pract 15(1): 190.
-
Brett Harnett, Daniel P Schauer, Mark H. Eckman, Pete Baker, Robert Ireton. Patient-Oriented Cohort System to Educate and Encourage Clinical Communications. Annal Biostat & Biomed Appli. 3(3): 2019. ABBA.MS.ID.000563.
Patient-Oriented, Cohort System, Bidirectional communications, Patient centered; Patient-physician relationship; Communications; Information systems, psychosis, mania, hypomania, severe cognitive impairment, current suicide risk, reported thoughts of violence.
-

This work is licensed under a Creative Commons Attribution-NonCommercial 4.0 International License.


