 Research Article
On The Identification of Some Species of the Cassieae Tribe Harvested in Cameroon Using Three Machine Learning Technics
Michèle Flore Yimga Fonkou1, William Kengne2, Richard Jules Priso1, Louis Aimé Fono3* and Ndongo Din1
1Laboratory of Botany - Faculty of Sciences-University of Douala, Douala-Cameroon B.P. 24157 Douala, Cameroon
1Laboratoire de Théorie Economique, Modélisation et Applications-CY Cergy Paris Université, 95011 Cedex, France
1Laboratory of Mathematics-Faculty of Sciences-University of Douala, Douala-Cameroon B.P. 24157 Douala, Cameroon
Louis Aime Fono, Laboratory of Mathematics - Faculty of Sciences - University of Douala, Douala-Cameroon B.P. 24157 Douala.
Received Date:March 14, 2023; Published Date:June 24, 2023
Abstract
Species from the Cassieae tribe are widely used as ornamental, medicinal and food plants despite their apparent similarities. In this paper, we study identification of these species by means of the description of their characteristics and by using three machine learning methods (Decision Tree, k-Nearest Neighbors and Support Vector Machine). For that, we collect, in the cities of Douala and Yaoundé in Cameroon, a set of 390 specimens (13 species and 30 per specie) and we describe each of them based on 24 variables (23 features variables and one target variable given the name of the specie). These algorithms are implemented on the obtained database by simple cross validation and 10-folds cross-validation, the performance of each of them was evaluated by means of four indicators: the error rate/accuracy of the model, the sensitivity, the specificity and the Area under the ROC curve (AUC). The minimum accuracy is 95.4% obtained with 10-folds cross-validation. These algorithms perform better on the balanced dataset than on the unbalanced dataset except for SVM which performs better on the unbalanced dataset than on the balanced dataset in 10-folds cross-validation (99.74% vs 99.48%).
Keywords:Species Identification; Decision tree learning; k-Nearest Neighbors; Support Vector Machine; Multiclass Classification.
Introduction
The countries of sub-Saharan Africa are rich in vegetal biological resources and several stakeholders (eco-physiologists, farmers, naturopaths, phyto-pharmacists, chemists, housewives, cosmetic industries, tourists) are increasingly interested in these resources for many reasons [1]. In order to have access to these resources, users must collect the samples and make an exact and accurate identification of the samples. The identification is a delicate key task because the similarity between species can cause users harmful confusion. The insufficiency and the impossible omnipresence of botanists as well as the inadequacy and/or inaccessibility of data on species of herbarium do not facilite this task for the general public and non-specialists [2-4]. In addition, thousands of specimens contained in herbaria have still not been identified in situ. These specimens should be reviewed and update as a result of more recent taxonomic knowledge. With the continued loss of biodiversity, the demand for systematic identification of species is likely to increase [3].
Therefore, it is useful to make available the plant identification
tools to the whole community. The use of automatic tools to identify
flowering plant species from natural images or the good data
collection and description by simulating the botanist’s action and
the collaborative data management tools is considered one of the
most promising solutions to help reduce the taxonomic gap [5]. Indeed,
specialists and general public have technological tools such as
mobile divices for data collection and remote access to sites or databases
of characteristics. With advances in data science (Big data,
machine learning), a recent approach is the automation of species
identification procedures for access and availability through a virtual
channel. We notice that machine learning is a type of artificial
intelligence that gives computers the ability to learn without being
explicitly programmed and which involves the implementation of
an algorithm aimed at predictive analysis using data for a specific
purpose [6]. This new approach is beneficial for
(i) The management of collections of living or dried plants (for the
biodiversity conservation, the production of nursery plants)
(ii) The control of the transfer of plant material and
(iii) The prospection in the field (in order to better characterize
soils for crop production).
The goal is to identify plants by simply comparing their description taken in the field to that of a database. In order to help users to have easily access for the description and classification of species, it is important to notice that many authors [7-15] used Machine Learning methods for plant identification.
Most of the authors carry out the identification of plants using Machine Learning algorithms on images of these plants. However, [15] noted that it is not always easy to have the images of all parts. In this study, we describe the morphological and reproductive characters of specimens of 13 species of the Cassieae tribe of the Fabaceae family collected in Cameroon. And we use three machine learning methods, namely Decision Tree Learning, Support Vector Machine (SVM), and k-Nearest Neighbors (k-NN), for their identification. These algorithms were implemented by taking into account the homogeneous and non-homogeneous distribution of the different species studied within the datasets, in order to study its influence on the performance of the different algorithms. Moreover, these authors only use the error/precision rate to evaluate their models. We believe that using multiple performance criteria is beneficial and more when datasets are not balanced. The performances of these algorithms were evaluated on the basis of several parameters, namely: the error rate/precision, the sensitivity and the specificity and the analysis of the ROC curves precisely the sum of the AUCs of the different ROC curves plotted. To the best of our knowledge, [15] and we are the ones who use the decision tree for plant identification and applied our algorithms on the feature dataset.
Notice that we choose species of that tribe for the two following
reasons:
(i) This family provides the greatest number of species useful to
humans (species of exploitation, food plants, medicinal and
even ornamental)
(ii) The species of this subfamily have a quite complex taxonomy
and a nomenclature and
(iii) Cassia and Senna species are widely used in traditional medicine
as tonic, laxative, diuretic, purgative [1] and antifungal
[16, 17]. In addition, the identification of species of that tribe
based of these methods have not yet studied.
The two research hypotheses of the framework of this paper
are:
(i) Good species description and sample collection would provide
a good basis for the development and implementation of applied
machine learning methods for plant identification.
(ii) Machine learning methods (Data Science tools) would allow
efficient identification of plants.
The rest of this paper is organized as follows. Section II presents a litterature review on the topic. Section III describes our proposed identification system. After data acquisition, data description, used tools and used numerical experiments, we describe the obtained results, their interpretations and we discuss these results compared to the existing ones. Section IV gives some concluding remarks.
Literature Review on the use of some Machine Learning methods for plant identification
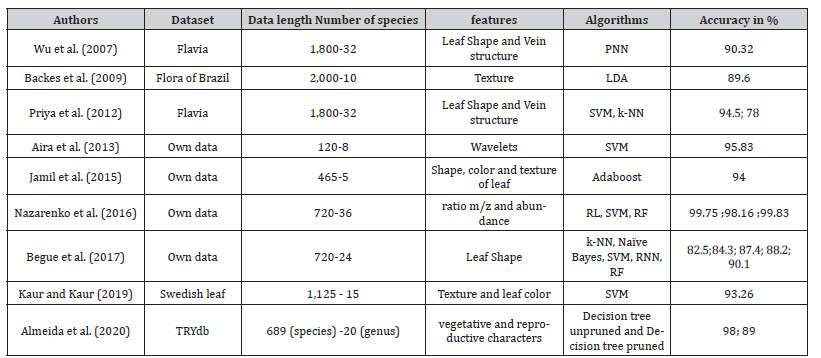
Wu SG [7] used the probabilistic neural network (PNN) and data processing techniques on a database of 1,800 leaf images of 32 species from the Flavia dataset to implement automatic leaf recognition. For that, they extracted five basic geometric features and they defined twelve numerical morphological features based on the shape and structure of veins in leaf images that constitute the input vector of the Probabilistic Neural Network (PNN). They obtained a classification accuracy higher than 90.32%.
Backes A R [8] presented a new volumetric approach based on Gabor filters and Fourier analysis on a database of 2,000 images of 10 species from the Brazilian flora leaf image database in order to extract morphometric features of leaf textures. They used the Linear Discriminant Analysis (LDA) algorithm and obtained classification accuracy 89.60%
Priya CA [9] developed a plant identification system using the Flavia dataset by picking up 12 numerical morphological features of shape and vein derived from five basic leaf features. They implemented the k-NN and SVM algorithms which achieved an accuracy of 78% and 94.5% respectively.
Aira K [10] developed a system using redundant discrete wavelet transform (RDWT) across plant leaves to extract translation invariant features from a collection of eight different ornamental plants in Indonesia with an accuracy of 95.8% using a SVM classifier.
Jamil N [11] used scale invariant function transformation, color moments, and segmentation-based texture analysis on a database of images of medicinal plant leaves belonging to five species in order to extract shape function, to represent color, and to describe texture features, respectively. The results show that the single texture feature outperformed the color or shape feature, achieving an identification rate of 92%. In addition, the fusion of the three features achieved an identification rate of 94%.
Nazarenko DV [12] implemented three machine learning methods (Logistic Regression (LR), SVM, and Random Forest (RF)) on a database of data pictograms (charge-to-mass ratio or m/z, abundance), obtained from 720 samples belonging to 36 species using liquid chromatography-mass spectrometry, for plant species identification. Classification accuracy greater than 95% was achieved on the cross-validation dataset for most of these algorithms.
Begue A [13] developed a system using their dataset of leaf images of 24 different medicinal plants. They extracted shape-based features from each leaf image (length, width, perimeter, area, number of vertices, color). A number of classifiers (k-NN, Naive Bayesian Classifier, SVM, Neural Network (NN), and RF) were used, among which the Random Forest classifier achieved the highest accuracy of 90.1% with the 10-folds cross validation technique.
Kaur S [14] used multiclass SVM with image processing techniques (Gaussian filtering mechanism) on database of 1,125 leaf images of 15 species from the Swedish dataset. A combination of 5 texture features and 4 color features were extracted and then the SVM classifier was used for classification with an average accuracy of 93.26%. Their obtained model could automatically classify 15 different plant species.
Almeida BK [15] conducted a study to assess the potential of Decision Trees (DT) for plant identification and to determine informative traits to distinguish genera, focused on a subset of 689 species divided into 20 genera, described by 16 vegetative and reproductive characters, belonging to the TRY plant database. The Unpruned Tree achieves an accuracy of 98% while the pruned tree achieves an average accuracy of 89% for classifying species into their genera. The evaluation of the significance of the characteristics revealed that 7 of the 16 characters were sufficient for classification.
To sum up, Table 1 (useful for comparison purpose on litterature review) presents the results obtained by the previous authors.
Table 1:Summary of results of the literature review
Proposed Identification System
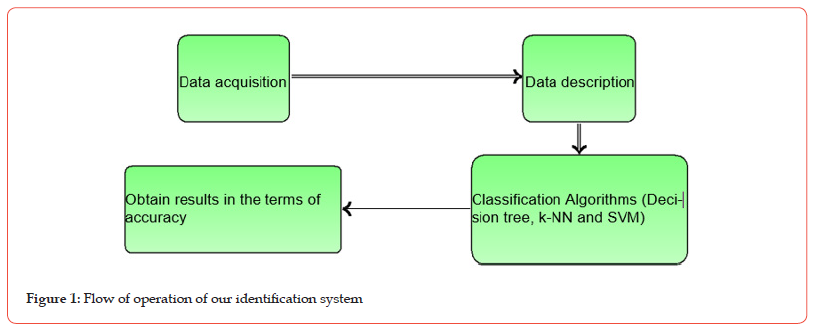
Similarly to [14], the flow of operation of our identification system is given by Figure 1.
Materials and methods Data acquisition and data description
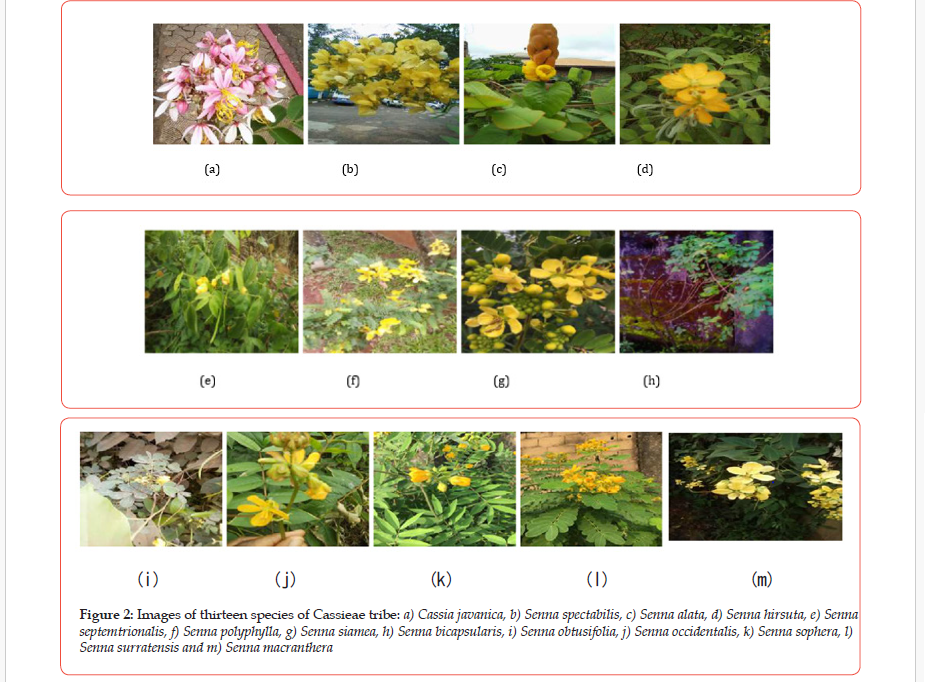
The data collection took place in the cities of Douala (03˚40’ - 04˚11’ of Nord Latitude and 09˚16’ - 09˚52’ of East Longitude) and Yaoundé (03˚52’12” of Nord latitude and 11˚31’12” of East longitude) of Cameroon from December 2019 to November 2020. The different activities of this collection phase (first phase) are: locate the sites of the described species, observe and describe the specimens characteristics directly in the field and collect samples (flowering branches, fruits). We harvest 390 specimens made up of thirty specimens of each of thirtheen species where images are given by Figure 2a.
After collection phase, we measure numerical characteristics of the collected samples in the Laboratory (second phase). A visit to the National Herbarium of Cameroon (third phase) was carried out in order to confirm the identification of the different harvested specimens using the collections of the Herbarium and the identification keys contained in the following three floras: Flora of Cameroon (Légumineuses Ceasalpinioideae [18]), Flora of Sénégal (Ficoidées à Légumineuses [19]) and electronic Flora of China.
Each specimen was described by 24 characters : one target variable giving the name of the species and denoted Y and 23 feature variables (explanatory variables denoted X1, ..., X23) made up of 11 qualitative characters and 12 quantitative characters (Height of plant, Shape of limb of leaflets, Disposition of leaves, Presence of glande, Pubescence on plants, Type of stipules, Length of Rachis, Minimum number of pairs of leaflets, Maximum number of pairs of leaflets, Apex of leaflets, Basis of leaflets, Length of petiole, Length of leaflets, Width of leaflets, Inflorescence, Length of sepals, Width of sepals, Length of petals, Width of petals, Flowers colors, Form of fruit, Length of fruit and Vegetative growth of plant). Consequently, the database (experiment data), used in this paper and obtained from all the three previous phases, is summarized in the descriptive Table available from the following link: https://www.researchgate. net/publication/ 352248679_Cassieaedataset. The table contains a total of 390 rows and 24 columns (one row for a specimen and one column for each character).
Tools and Numerical experiments
Computations were performed in Version 3.6 of the R software with packages rpart, e1071 and DmWR respectively for Decisio tree, SVM and k-NN and with package pROC for roc curves.
The three used machine learning methods were applied using two approaches of cross validation, namely, random cross validation and 10-folds cross validation. For each algorithm, the dataset was divided in two types, namely balanced dataset and unbalanced dataset, in order to take into account the homogeneity and non-homogeneity in the distribution of individuals (specimens) within the classes (details of the two approaches are described in Appendix II). These algorithms are implemented and tested, and their performances are evaluated by means of four indicators: the error rate/ accuracy of the model, the sensitivity, the specificity and the Area under the ROC curve (AUC).
Results and interpretations 10-folds cross-validation of the implementation of the three models
For each of the three models, the 10-folds cross-validation was implemented and trained 100 times. The accuracy (equal to the difference between 1 and the average rate error) of each algorithm obtained for the two data sets is represented by the bars graphs in Figure 3. These bars graphs show very good accuracy (at least 95%) of the identification of the species of our database by each of the three models. Moreover, this accuracy is generally better on the balanced dataset than on the unbalanced dataset and it is better with the decision tree.

Implementation of Decision tree algorithm on data by random cross validation
a) Description of the obtained decision trees
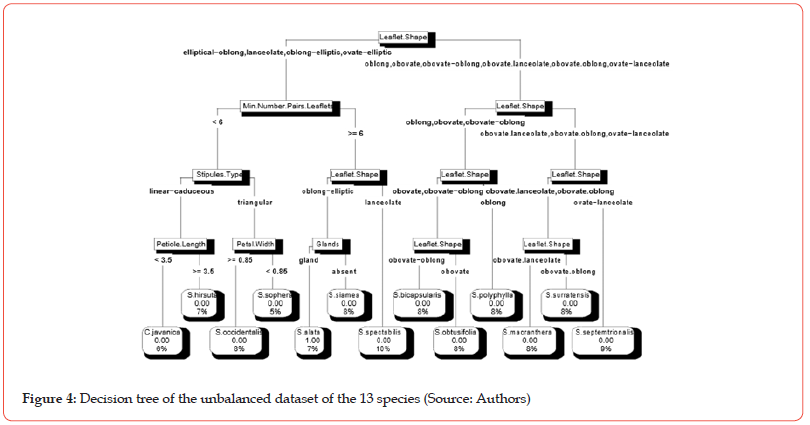
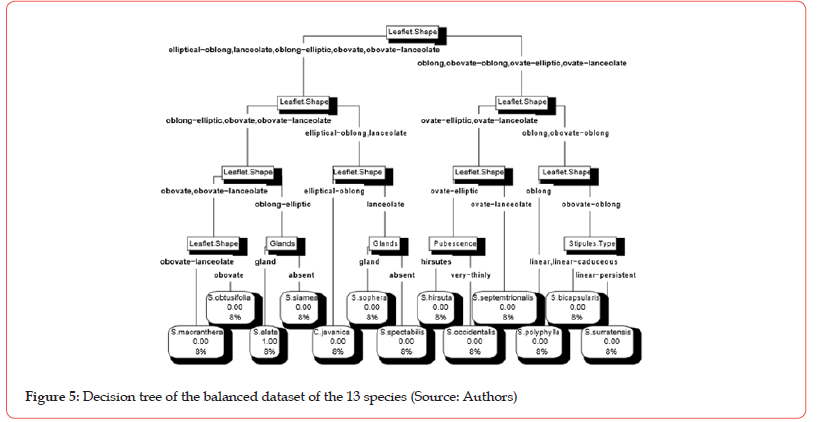
The different cross-validation tests with Decision tree algorithm on two datasets (balanced and unbalanced) provided an optimal value of the complexity parameter (cp) equal to 0.01 with a set of 12 nodes (questions). Figure 4 and Figure 5 present two decision trees obtained by implementing Decision tree algorithm with that value of cp on the balanced dataset and on the unbalanced dataset respectively.
The name assigns to a given leaf of the tree is the name of the most represented specie (mode) in the considered group. Thus, from the left to the right, the leaves of the tree in the Figure 4 are mainly made up of specimens belonging respectively to the species: C. javanica, S. hirsuta, S. occidentalis, S. sophera, S. alata, S. siamea, S. spectabilis, S. bicapsularis, S. obtusifolia, S. polyphylla, S. macranthera, S. surratensis and S. septemtrionalis. From the left to the right, the leaves of the tree in the Figure 5 are mainly made up of specimens belonging respectively to the species: S. macranthera, S. obtusifolia, S. alata, S. siamea, C. javanica, S. sophera, S. spectabilis, S. hirsuta, S. occidentalis, S. septemtrionalis, S. polyphylla, S. bicapsularis and S. surratensis.
b) Confusion matrix and interpretation
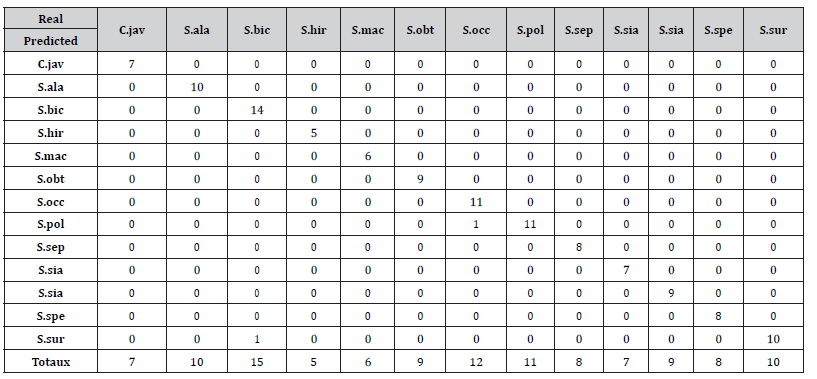
Table 2 presents the confusion matrix resulting from the predicted target variable, on the unbalanced data set, by the algorithm with the predicted classes in row and the known classes in column. The last row contains total of each column. These totals mean that the test dataset contained 7 specimens of C. javanica, 10 specimens of S. alata, 15 specimens of S. bicapsularis, 5 specimens of S. hirsuta, 6 specimens of S. macranthera, 9 specimens of S. obtusifolia, 12 specimens of S. occidentalis, 11 specimens of S. polyphylla, 8 specimens of S. septemtrionalis, 7 specimens of S. siamea, 9 specimens of S. sophera, 8 specimens of S. spectabilis and 10 specimens of S. surratensis. By adding all these values, we have 117 individuals in the test dataset. In each column (labelled by a specimen), it appears that the trained model implemented on unbalanced test data set correctly forecasted the target variable of that specimen except the two following species : one specimen of S. bicapsularis was predicted by the model as belonging to S. surratensis (see coefficient 1 in the row labeled S. sur and the column labelled S. bic) and one specimen of S. occidentalis was predicted by the model to belong to S.polyphylla (see coefficient 1 in the row labeled S. pol and column labelled S. occ). In other words, the model was wrong twice and thus it provides an error rate at the end of the test equal to 1.7% for an accuracy of 98.3%.
Table 2:Confusion matrix of the unbalanced 13-species data set for the Decision Tree (Source: Authors)
For the balanced data set, the confusion matrix is a table similar to the Table 2 with the coefficient 9 repeated 13 times in the main diagonal and in the last row (row of totals). Thus, the test data set contained a total of 9 specimens of each of the 13 species and their sum gives a total of 117 individuals in the test data set. The model obtained by the decision tree on the balanced test dataset correctly predicted the target variable of each of these specimens, in other words, the model was not wrong. As a result, the error rate of the model after the test is 0% and an accuracy of 100%: This is due probably to the fact that the test and training data sets are perfectly balanced.
c) Model sensitivity, specificity and interpretations
Table 3 (resp. Table 4) gives the values of the sensitivity and the specificity of the model for the unbalanced (resp. balanced) datasets when the specie specified in the column is considered as the positive class and the other species are considered as the negative class. Note that the sensitivity (resp. specificity) indicates the percentage of the model’s correct prediction of the specimens in the positive (resp. negative) class. The sensitivity and the specificity values in Table 4 are all equal to 1 expressing a perfect prediction of the class of each specimen by the decision tree model applied to the balanced dataset of our database. When the decision tree is applied to the unbalanced dataset of our database, we obtain a perfect prediction of the identification of specimens of 9 of the 13 species (see the nine columns with 1 twice as coefficient) and the model makes a very good prediction on the identification of specimens of each of the 4 species (S. bic, S. occ, S. pol and S. sur<) considered as a positive class.
Table 3:Sensitivity and specificity of the unbalanced dataset of 13 species for the Decision Tree model (Source: Authors)

Table 4:Sensitivity and specificity of the balanced dataset of 13 species for the Decision Tree model (Source: Authors)

Implementation of the k-NN algorithm on the data by random cross validation
a) Number of neighbors and confusion matrix
The different tests of the cross-validation on the unbalanced (resp. balanced) dataset provided a number of neighbors k minimizing the prediction error and equal to k = 14 (resp. k = 13). These values are those used to implement the different k-NN algorithms.
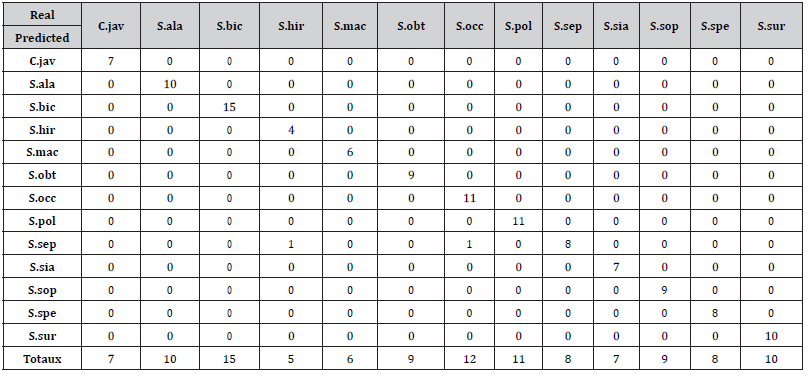
The confusion matrix obtained from the prediction of the target variable on the unbalanced test data by the model is presented in Table 5. It appears (see each column of the Table 11) that the k-NN algorithm correctly predicted the class of belonging of each of these specimens except two: a specimen of S. hirsuta and a specimen of S. occidentalis were predicted by the model as belonging to S. septemtrionalis (see coefficient 1 of the 10th row and 5th column and coefficient 1 of the 10th row and 8th column of Table 5). In other words, the model was wrong twice, thus having an error rate at the end of the test equal to 1.7% for an accuracy of 98.3%: The confusion matrix for the balanced dataset is similar to Table 5 except for the last row which counts 9 specimens of each species. The error rate and precision are also identical.
Table 5:Confusion matrix of the unbalanced 13-species data set for the k-NN (Source: Authors)
b) Sensitivity and specificity
Table 6 (resp. Table 7) gives the sensitivity and specificity values of the model for balanced (resp. unbalanced) datasets when the species specified in column is considered as positive class and the other species are considered as negative class. When k-NN is applied to each of the two test datasets (balanced and unbalanced), the algorithm performs a perfect prediction of the target variables of the specimens of 10 species (see the ten columns with 1 twice as coefficient) and it performs a good prediction on the identification of the specimens of each of the 3 species (S. hirsuta, S. occidentalis and S. septemtrionalis) considered as positive class.
Table 6:Sensitivity and specificity of the unbalanced data set for the k-NN model (Source: Authors)

Table 7:Sensitivity and specificity of the balanced data set for the k-NN model (Source: Authors)

Implementation of the SVM algorithm to the data by random cross validation
a) Confusion matrix
The SVM algorithm was implemented on two different data sets (unbalanced and balanced) and the best model performance was obtained for the linear kernel. Table 8 presents the confusion matrix from the implementation of the SVM algorithm on unbalanced test dataset. The SVM algorithm correctly predicted the class of each of these specimens except for one class: the coefficient 1 of the row S. spe and column S. hir of Table 8 means that one specimen of S. hirsuta was predicted by the model as belonging to S. septemtrionalis. In other words, the model was wrong once having thus an error rate of the model equal to 0.85% for an accuracy equal to 99.15%. Implemented on the balanced dataset, the model obtained by the SVM correctly predicted the class of belonging of each of these 13 specimens, in other words, the model did not make a mistake having thus an error rate of 0% for an accuracy of 100%.
b) Sensitivity and specificity
Table 9 (resp. Table 10) gives the sensitivity and the specificity values of the model for the unbalanced dataset (resp. balanced dataset) when the species specified in column is considered as the positive class and the other species are considered as the negative class. The sensitivity and specificity values in Table 10 are all equal to 1 expressing a perfect prediction of the class membership of each specimen in the balanced test dataset by the SVM model. When the SVM is applied to the unbalanced test dataset of our database, Table 9 illustrates that this algorithm makes a perfect prediction of the identification of specimens of 11 of the 13 species and it makes a very good prediction on the identification of specimens of each of the 2 species (S. hirsuta and S. septemtrionalis) considered as the positive class.
Table 8:Confusion matrix of the unbalanced 13-species data set for the SVM (Source: Authors)
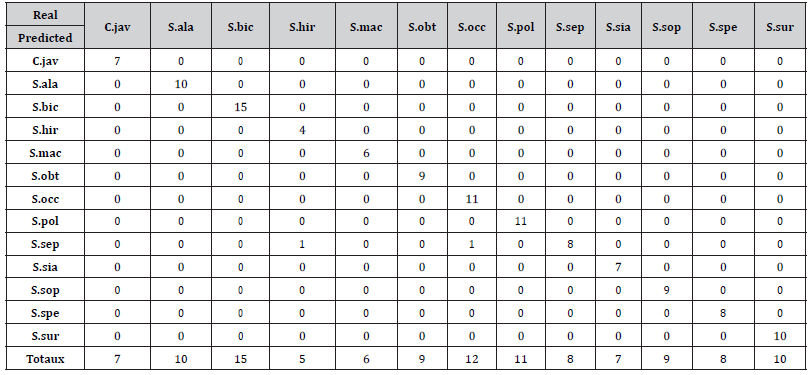
Table 9:Sensitivity and specificity of the unbalanced data set for the SVM model (Source: Authors)

Table 10:Sensitivity and specificity of the balanced data set for the SVM model (Source: Authors)

ROC curves and evaluation of AUC for each algorithm
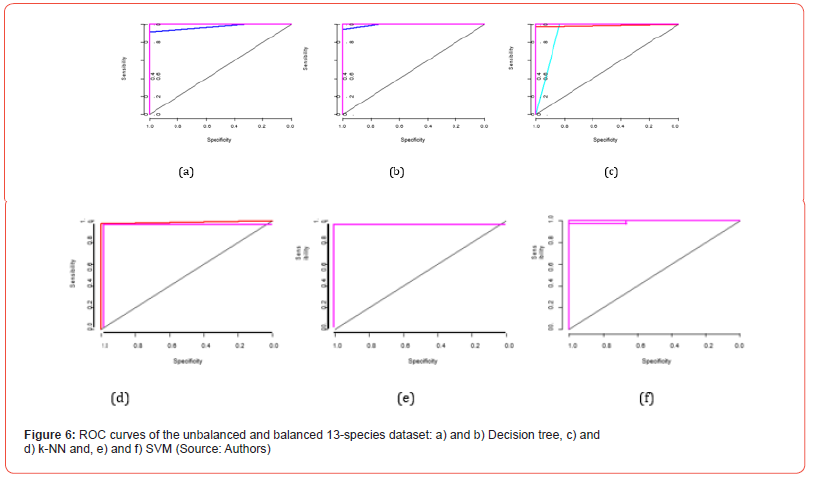
Figure 6 presents six graphs (two by algorithm) of 13 ROC curves (one for each class). Indeed, for each ROC curve, one class is considered as positive and the rest of the twelve other classes as negative.
In each graph, we observe that the bisector (in black) gives the critical threshold for the classification whose AUC is 0.5: For each of three algorithms, all the curves are above the threshold. As a result, the ROC analysis reveals that each of these three algorithms has very good prediction performance on our data set. In addition, the sum of the AUC for each graph is calculated and the results are presented in Figure 7. We deduce that:

(i) Each algorithm performs better on balance dataset than on unbalanced
dataset and
(ii) The decision tree model presents, on our data set, better performance
for the ROC curve than the SVM and the k-NN.
Discussions
Comparison of the performances of the three models applied to our database
Table 11:Comparison of the performances of the different algorithms trained on the unbalanced dataset (Source: Authors)

Table 10:Comparison of the performances of the different algorithms trained on the balanced dataset (Source: Authors)

Table 11 and Table 12 present the four performance evaluations of the results of the implementations of the three algorithms (Decision Tree, k-NN and SVM) applied to the balanced and unbalanced datasets respectively.
From the analysis of these two tables, it appears that:
– The Decision Tree is most efficient than SVM which itself is
most efficient than k-NN on each of the two data sets.
– The implementation of these algorithms generally most
efficient on the balanced dataset than on the un-balanced dataset.
Let us end this paragraph with the appreciation of the results
obtained from the implementation of three models on our database
with respect to the two research hypotheses of this paper.
– The Decision Tree model was realized by taking into account
all the 23 (qualitative and quantitative) feature variables of our
dataset while k-NN and SVM were realized by taking into account
the 12 quantitative feature variables of the dataset. The better performance
obtained with the Decision Tree corroborates with our
first hypothesis which stipulates that a good description of the sample
specimens would be a good basis for the implementation of machine
learning methods applied to plant identification.
– For the implementation of a predictive model, we will choose
the decision tree algorithm because its implementation used all the
feature variables, and thereby it is the one which provides the best
performance
when identifying a new specimen. This corroborates our second hypothesis which stipulate that Machine Learning methods would be effective in identifying plants.
Comparison with other models
Several authors [7-15] based their frameworks on species belonging to different families, certainly depending on the topic of their studies (study of medicinal plants, study of plants of a region, etc). Our study concerns species belonging to two genera (Cassia and Senna) of the tribe of Cassieae, family Fabaceae. We are interested in the species of this family because it is the third largest family of plants that provides the greatest number of useful species to human being. A new dataset on Cassieae plants in Cameroon has been made publicly available on the Research gate.
Some authors [7, 9] implemented the learning methods (SVM and k-NN) on unbalanced dataset. [7] explained their choice by the insufficiency leaf samples from certain species depending of the study region. Other authors [1, 14] implemented these methods on balanced dataset: [12] explained this choice by maintaining homogeneity between the data. We implement our three learning methods (Decision Tree, k-NN, and SVM) on both types of data subdivision (balanced and unbalanced dataset) with the goal of measuring the impact of each subdivision on the error rate. Analysis of our results shows that the error rate is generally lower with the balanced dataset than with the unbalanced dataset. However, this difference is not very important and we believe that it will be in the case where the heterogeneity of the classes will be very pronounced within the dataset. Moreover, the maximum error rate of implementation of Learning methods for the previous works is 22% [9] for k-NN while ours is 4.6% for k-NN.
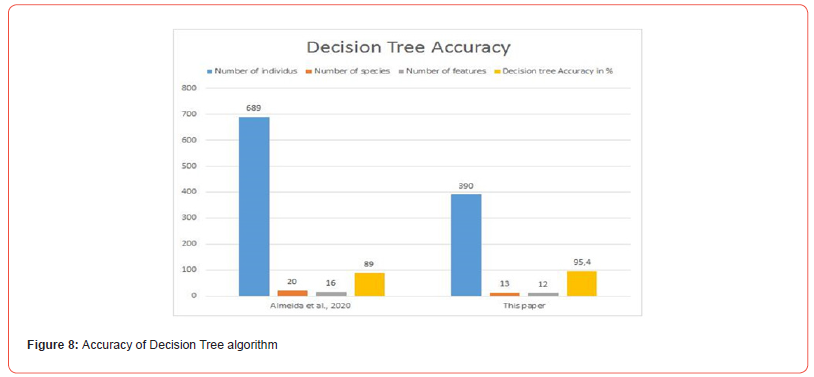
Almeida BK [15] applied the decision tree algorithm to a dataset containing 689 species distributed in 20 genera described by 16 vegetative and reproductive characters. They obtained an average accuracy of 98% for the unpruned decision tree and 89% for the pruned decision tree for the classification of species into genus. This paper applied the decision tree algorithm to a dataset containing 390 specimens distributed in 13 species, described by 23 vegetative and reproductive characters and obtained a minimum accuracy of 99.87% (see Figure 8). Results of [15] reveal that the decision tree has good potential for plant identification. Our results corroborates with their results.
Priya CA [9] used 1,800 specimens belonging to 32 species described by 12 characters. The accuracy of the implementation of the k-NN algorithm on their database reaches 78%. [13] applied the k-NN algorithm to a set of 720 specimens divided into 24 species described by 40 characteristics. They reached an accuracy of 82.5%. In this paper, the k-NN algorithm was applied to a dataset containing 390 specimens distributed in 13 species described by 12 characters, the minimum accuracy obtained is 95.4% (see Figure 9).
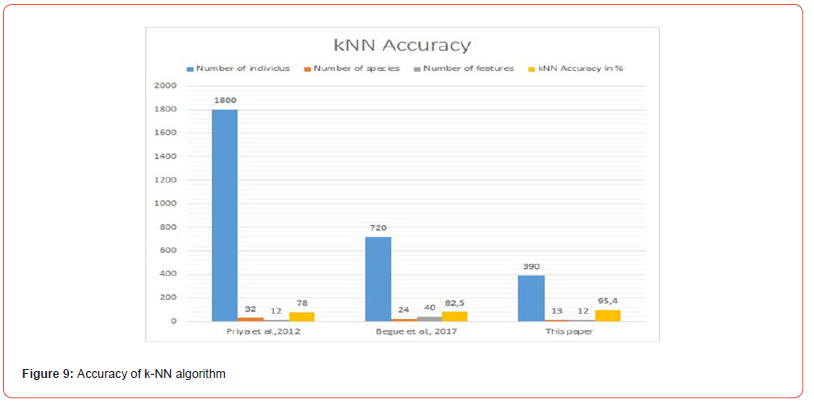
Each of these authors have a number of specimens and a number of species greater than those of this study. The number of characteristics studied is greater than or equal to that of this study. The results of this paper obtained by 10-folds cross-validation are more efficient than theirs. This could be explained by the used specimen description process: in fact the description of specimens in this study covers several parts of them, while these authors base their descriptions on the characteristics of the leaf. This confirms our first research hypothesis.
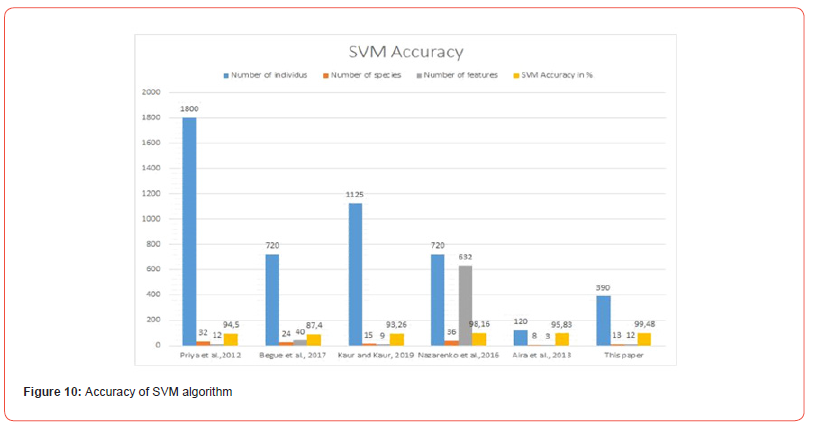
Priya CA [9] used 1,800 specimens belonging to 32 species described by 12 characters. The accuracy of the implementation of the SVM algorithm on their database reaches 94.5%. [10] applied the SVM algorithm to a dataset containing 120 specimens distributed in 8 species described by 3 characters. They obtained an accuracy of 95.83%. [12] used a dataset containing 720 specimens distributed in 36 species described by 632 characters. The accuracy of the implementation of the SVM algorithm on their dataset reaches 98.16%. [13] applied the SVM algorithm to a set of 720 specimens divided into 24 species described by 40 characteristics. The SVM algorithm achieves an accuracy of 87.4% on their dataset. [14] used 1,125 specimens belonging to 15 species described by 9 characters. The accuracy of the implementation of the SVM algorithm on their dataset reaches 93.26%. In this paper, the SVM algorithm was applied to a dataset containing 390 specimens distributed in 13 species described by 12 characters, the minimum accuracy obtained is 99.48% (see Figure 10).
Priya CA [9, 12-14] have each a number of specimens and a number of species greater than those of this study. [9,12] and [13] each have a number of characteristics greater than or equal to that of this study. The results of this study obtained by 10-folds cross-validation are more efficient than theirs for the SVM. This could be explained by the used specimen description process: in fact the description of specimens in this study covers several parts of them, while these authors base their descriptions on the characteristics of the leaf. This confirms our first research hypothesis.
For [10], the number of species, the number of characteristics as well as the size of the dataset of these authors are smaller than those of this study. SVM is more efficient on the data set of this study. However, the literature states that the implementation of SVM provides better performance when one has a small training dataset because it requires less notions of matrix computation and parameter computation time. In other words, SVM tends to decrease in performance when the training dataset is large.
The results of [9] and [13] also show that SVM has better performance than k-NN on their dataset, the results of this study corroborate with their results.
Some authors use preconceived datasets, such as [7] (Flavia dataset), [8] (Flore of Brazil), [9] (Flavia dataset), [14] (Swedish leaf) and [15] (TRYdb), which justifies their more large volume of data. While other authors [10], [11-13] and this paper uses their specific collected data. This justifies the small volume of data used by in these authors because data collection is not an easy step.
To our knowledge, this work is the first in plant identification which studies the influence of balanced and unbalanced dataset on the performances of the Machine Learning algorithms and which evaluates the algorithm on the basis of several indicators of performance.
Conclusion
The objective of this work was to develop protocols for the identification of species of the tribe Cassieae found in Cameroon using machine learning methods and based on the features description of these species. A set of 390 specimens were previously described on the basis of 24 characters (23 feature variables and one variable explaining and designating the specie name) and the data recorded in the descriptive table. Examination of the descriptive table shows that these plants are trees, shrubs and herbaceous plants with leaves that are generally composed of paripinnate leaves in alternate positions on the branches with opposite leaflets.
A careful analysis of the results of the implementation of the algorithms according to the 10-folds cross-validation approach on the database shows that : The Decision Tree algorithm performs better (minimum average accuracy 99.87% and minimum AUC sum equals 12.986) than SVM (minimum average accuracy is 99.48% and minimum AUC sum is 12.981) which performs better than k-Nearest Neighbors (minimum average accuracy is 95.4% and minimum AUC sum is 12.91). In addition, the Decision Tree method is implemented using all the variables of our dataset while the other algorithms are implemented only with the quantitative variables. Thus, we propose the decision tree method for the deployment of an application of a identification model of the species of the tribe of Cassieae. The results obtained corroborate with the two research hypotheses of this framework. These algorithms perform better on the balanced dataset than on the unbalanced dataset with the exception of SVM (which performs better on the unbalanced dataset than on the balanced dataset (99.74% vs. 99.48%). In other words, whether the dataset is balanced or not has a slight influence on the performance of the algorithms we have developed.
To the best of our knowledge, this work is the first of its kind to have created a characteristic dataset for plants containing vegetative and reproductive characters of species of Cassieae tribe that are available in Cameroon. This dataset must be continuously revised by incorporating new taxonomic knowledge and updated by adding new species from the same family and those of the others families encountoured in Africa, precisely in Cameroon which is Africa in miniature, in order to obtain a larger database susceptible to serve the expectations of users. The use of this database will help the local population to improve their knowledge on plants identification, help taxonomists to develop more efficient species identification techniques and will also contribute significantly in the protection of endangered species.
Acknowledgement
This work was done under the research grant FR 21-333 RG/ MATHS/AF/AC_G-FR 3240319514 from Unesco-TWAS and the Swedish International Development Cooperation Agency (SIDA). The views expressed herein do not necessary represent those of UNESCO-TWAS, Sida or its Board of Governors.
Conflict of Interest
None.
References
- Yimga MF, Kamdem JP, Fono LA, Priso RJ (2018) Identification keys of seven Cassia species from the Caesalpiniodeae: Fabaceae. International Journal of Plant, Animal and Environmental Sciences 8(4): 5-17.
- Hopkins G, Freckleton R. (2002) Declines in the numbers of amateur and professional taxonomists: implications for conservation. Animal Conservation 5(3): 245-249.
- Ceballos G, Ehrlich PR, Barnosky AD, Garca A, Pringle RM, et al. (2015) Accelerated modern human-induced species losses: Entering the sixth mass extinction. Science Advances 1(5): 1-5.
- Wäldchen J, Mäder P (2017) Plant Species Identification Using Computer Vision Techniques: A Systematic Literature Review. Archives of Computational Methods in Engineering 25(2): 507-543.
- Bonnet P, Goëau H, Thye SH, Lasseck M, Šulc M, et al. (2018) Plant Identification: Experts vs. Machines in the Era of Deep Learning. Deep Learning Techniques Challenge Flora Experts. Springer International Publishing AG, part of Springer Nature 2018. A. Joly et al. (eds.), Multimedia Tools and Applications for Environmental and Biodiversity Informatics, Chapter 8: 131-149.
- Grolleau E (2017) Introductionà lapprentissage automatique-Machine learning. Observatoire de Paris-LESIA-Service d’Informatique Scientifique p. 197.
- Wu SG, Bao FS, Xu E Y, Wang YX, Chang YF, et al. (15-18 December 2007) A leaf recognition algorithm for plant classification using probabilistic neural network. Proceedings of 2007 IEEE International Symposium on Signal Processing and Information Technology 11-16, Le Meridien Pyramids Cairo, Egypt.
- Backes A R, Casanova D, Bruno O M (2009) Plant Leaf Identification based on Volumetric Frac-tal Dimension. International Journal of Pattern Recognition and Artificial Intelligence 23(6): 1145-1160.
- Priya CA, Balasaravanan T, Thanamani A S (2012) An efficient leaf recognition algorithm for plant classification using support vector machine, In Proceedings of International Conference on Pattern Recognition, Informatics and Medical Engineering pp. 428-432.
- Aira K, Abdullah I N, Okumura H (2013) Identification of Ornamental Plant Functioned as Me-dicinal Plant Based on Redundant Discrete Wavelet Transformation. International Journal of Advanced Research in Artificial Intelligence 2(3): 60-64.
- Jamil N, Che Hussin N A, Nordin S, Awang K (2015) Automatic Plant Identification: Is Shape the Key Feature? 2015 IEEE International Symposium on Robotics and Intelligent Sensors (IRIS 2015). Procedia Computer Science 76(2015): 436-442.
- Nazarenko DV, Kharyuk P V, Oseledets I V, Rodin I A, Shpigun O A, et al. (2016) Machine learning for LC-MS medicinal plants identification. Chemometrics and Intelligent Laboratory Systems 156(2016): 174-180.
- Begue A, Kowlessur V, Mahomoodally F, Singh U, Pudaruth S, et al. (2017) Automatic recognition of medicinal plants using machine learning techniques. Internationnal Journal of Advanced Computer Science and Applications 8 (4): 166-175.
- Kaur S, Kaur P (2019) Plant Species Identification based on Plant Leaf Using Computer Vi-sion and Machine Learning Techniques. Journal of Multimedia Information System 6(2): 49-60.
- Almeida BK, Garg M, Kubat M, Afkhami ME (2020) Not that kind of tree: Assessing the potential for decision tree-based plant identification using trait databases. Applications in Plant Sciences 8(7): 1-7.
- LPWG (2017) A new subfamily classification of the Leguminosae based on a taxonomically comprehensive phylogeny. Phylogeny and classification of Leguminosae. Taxon 66(1): 44-77.
- Sebihi FZ (2008) Les Bactéries Nodulant les Légumineuses: caractérisation des bactéries associées aux nodules de la Légumineuse Fourragère, Hedysarum perrauderianum. Masteren Génétique et Amélioration des plantes. Département de Biologie Végétale, Faculté des Sciences dela Natureetdela Vie, Université Mentouri de Constantine- Algerie p. 121.
- Aubreville A (1970) Légumineuses-Césalpinoïdé La Floredu Cameroun, Muséum Nationald Histoire Naturelle, Laboratoirede Phanérogamie 16, rue Buffon, Paris 5e, 51-70.
- Berhault J (1975) Ficoidéesà Lé Flore illustrée du Sénégal. Dicotylédones. Gouvernement du Sénégal, Ministère du Développement Rural et de l’Hydraulique, Direction des Eauxet Forêts, Dakar, Sénégal pp. 4: 625.
-
Michèle Flore Yimga Fonkou, William Kengne, Richard Jules Priso, Louis Aimé Fono*, Ndongo Din. On The Identification of Some Species of the Cassieae Tribe Harvested in Cameroon Using Three Machine Learning Technics. Annal Biostat & Biomed Appli. 5(4): 2023. ABBA.MS.ID.000616.
Species Identification, Decision tree learning, k-Nearest Neighbors, Support Vector Machine, Multiclass Classification, Phyto-pharmacists, Cosmetic industries, Discriminant Analysis
-

This work is licensed under a Creative Commons Attribution-NonCommercial 4.0 International License.


