


 Review Article
Mathematical Derivation of the Basic Reproduction Number in SVEQAITR Epidemic Model of Covid-19 Reinfection using the Next-Generation Matrix
Received Date: August 07, 2025; Published Date: November 07, 2025
Abstract
This study presents the mathematical derivation of the basic Reproduction Number for a novel SVEQAITR (Susceptible-Vaccinated-Exposed- Quarantined-Asymptomatic-Infectious-Treated-Recovered) epidemic model of Covid-19 and its reinfection dynamics. The model is formulated as a system of ordinary differential equations to capture the complex dynamics of infectious diseases, incorporating key public health interventions such as vaccination, quarantine, and treatment. Using the widely recognized Next-Generation Matrix (NGM) method, the derivation focuses on identifying the disease-free equilibrium and partitioning the model into infected and uninfected compartments. The basic Reproduction Number (R 0) , is then rigorously determined as the spectral radius of the next-generation matrix. This critical epidemiological threshold parameter quantifies the average number of secondary infections produced by a single infected individual in a completely susceptible population. The derived (R 0) shows that the Disease Equilibrium Point is locally stable and Covid-19 will fizzle out of the population over time. The analytical expression for (R 0 ) enables policymakers and public health officials to understand the conditions under which disease outbreaks can be contained and to optimize intervention efforts for more effective disease management.
Keywords:Basic reproduction number; next-generation matrix; spectral radius; (SVEQAITR) Susceptible Vaccinated Exposed Quarantined Asymptomatic Infectious Treated Recovered model; and Mathematical Epidemiology
Introduction
The COVID-19 pandemic, caused by the Severe Acute Respiratory Syndrome Coronavirus 2 (SARS- CoV-2), has posed unprecedented global health and socioeconomic challenges since its emergence in late 2019. While initial efforts focused on understanding primary infection dynamics, the increasing prevalence of reinfection cases has highlighted the critical need for comprehensive models that capture the complexities of waning immunity, viral evolution, and vaccination efficacy in preventing subsequent infections [1,2]. Mathematical epidemiology has proven an indispensable tool in this endeavour, providing frameworks to analyse disease transmission, predict outbreak trajectories, and evaluate the impact of control strategies [3,4]. A key parameter in epidemiology for understanding and mitigating infectious diseases is the basic reproduction number R 0 . This dimensionless measure represents the average number of secondary infections generated by a single infectious individual in a completely susceptible population [5,6]. When R 0 >1 , the disease continues to spread, whereas R 0 <1 indicates that it will eventually decline. The next-generation matrix (NGM) method, introduced by [7] and expanded by [8], is a standard approach for deriving R0 in compartmental epidemic models.
This technique systematically determines the disease-free equilibrium and then linearizes the system to construct matrices that define new infections and transitions within infected compartments. In the context of COVID-19, various compartmental models have been developed to capture different aspects of its transmission dynamics, including SEIR-type models incorporating vaccination, hospitalization, and asymptomatic cases [9]. However, accurately modeling COVID-19 reinfection requires a more refined approach that accounts for individuals who have recovered from an initial infection but may become susceptible again. The Susceptible-Vaccinated- Exposed-Quarantined-Asymptomatic-Infectious-Treated- Recovered (SVEQAITR) compartmental model offers a comprehensive framework to investigate these complex dynamics, integrating key features such as vaccination, quarantine measures, and distinct classes for asymptomatic and symptomatic infections, along with treatment and recovery with potential loss of immunity. This study seeks to mathematically derive the basic reproduction number (R 0 ) for a new SVEQAITR epidemic model designed specifically to address the dynamics of COVID-19 reinfection.
Using the next-generation matrix method, we will systematically examine the contributions of various infection pathways and parameters to overall virus transmissibility. The resulting analytical expression for R 0 will provide valuable information on the conditions under which COVID-19 reinfection may persist or be controlled, thus informing public health interventions and vaccination strategies in the continued fight against the pandemic. The purpose of this paper is to derive the basic reproduction number in the SVEQAITR epidemic model of Covid-19 reinfection using the next generation matrix and analyse its implications. The organization of the paper is as follows, Section 2 elaborates on the Model Formation by stating the assumptions, compartmental diagrams, state variables, parameter variables, system of differential equations, initial conditions, and positivity of solutions employed in constructing the model. In Section 3, Mathematical analysis is discussed by deriving the disease-free equilibrium of the model, application and derivation of the Next generation matrix, and interpretation of the basic reproduction number. In Section 4, we present and discuss the key findings and conclude in Section 5.
Model Formation
In this paper, we study the epidemiology of Covid-19 with its reinfection using the Susceptible, Vaccinated, Exposed, Quarantined, asymptomatically infected, symptomatically infectious, Treatment and Recovered model. The results of the research will aid in predicting the risk factors affecting reinfection of Covid-19 and the optimum strategies to implement in order to prevent and control the spread and re-occurrence of the virus.
Assumptions of the Model
This model works on the following assumptions:
1. That the rate of disease transmission from asymptomatic
infected individuals are less than that of the symptomatic infected
and treated individuals  ;
;
2. That the symptomatic infected and treated individuals
experience additional disease-induced death rate 
3. That the asymptomatic infected disease-induced death
rate δ is negligible;
4. All individuals are decreased by natural death rate
N −μ N;
5. Since there is currently no evidence that individuals develop
permanent immunity against Covid-19. Therefore, it is assumed
that the recovered individuals become susceptible again at
the rate of ; φ(R −φr );
6. Quarantined individuals who do not show symptoms
while in quarantine are transferred back to susceptible class at rate
σ (1−θ ) i.e,(Q −σ (1−θ ));
7. That the symptomatic infected individuals can either be
treated or recovered; i. e,  ;
;
8. That the vaccinated individuals can become exposed
to the disease at β2( 1−ε) , meaning that vaccination wane after
a short period of time thereby provides only partial protection
against Covid-19; i e, (V −β2 (1−ε )) ;
9. That recovered individual can become re-infected again
when they come in close contact with asymptomatic, symptomatic
and treatment class because of the inefficacy of drugs i.e., (R −φ r);
10. That all parameters in the model are assumed to be positive
or non-negative.
Individuals are recruited into the population at a rate ΛS.V is the vaccination class since Covid-19 is biologically available, and then it is realistic to consider the vaccination class, η V is the transmission rate from susceptible to the vaccination class. λ1 S is the force of infection from susceptible to exposed class while λ2 V is the force of infection from vaccinated individuals to exposed class? β1(A+I+T)S and β2(1−ε ) V are effective contact rates. ε represents the infection reduction of vaccinated individuals. α1 E is the rate of exposure to quarantine, α2 E is the rate of exposure to asymptomatic, and α3 E is the rate of exposure to infectious class? The quarantined individuals increase as a result of the quarantining of individuals of the exposed class at the rate α1 E . Individuals who do not show symptoms while in quarantine are transferred back to the susceptible class at a rate of σ (1−θ )Q , and individuals who showed Covid-19 symptoms while in quarantine are moved to the infectious class at a rate of σθQ for medical attention. Asymptomatic individuals are reduced by the natural death rate μ , but δ , which is death due to the disease in this class, is assumed to be negligible, because individuals in this class do not show Covid-19 symptoms but are fully infected.
Those who develop Covid-19 symptoms are moved to the symptomatic class at a rate of (1−τ ) , while a fraction τ may recover naturally from asymptomatic infection and move to the recovered class R . Individuals exit the symptomatic infected class through the natural death rate μ and through death due to the disease δ . The fraction of (1−ψ ) is hospitalized for treatment while the fraction ψ recovers naturally. Finally, hospitalized individuals (T )are treated and recovered at a rate γ3 . Individuals also leave the treatment class through a natural death rateμ and through a death from the disease δ . We also consider that recovered individuals(R) die naturally μ and a fraction φ becomes susceptible(S ) again because individuals lose permanent immunity to Covid-19 and are prone to reinfection. Considering the definitions, assumptions and interrelations between the variables and the parameters, the basic dynamics of Covid-19 re-infection is illustrated as a flow diagram in Figure 1 represents the SVEQAITR model with vital dynamics.
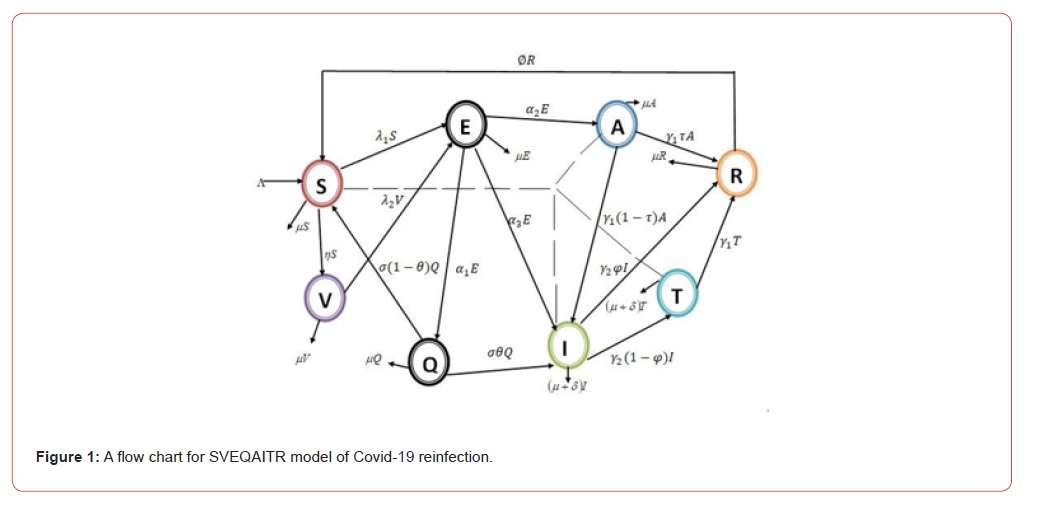
Description of the SVEQAITR Model of Covid-19 with Reinfection
In applying the SVEQAITR model, we have succeeded in dividing
the population into eight classes namely; The Susceptible class
(S);
The Vaccinated class (V);
The Exposed class (E);
The Quarantined class (Q);
The Asymptomatically Infectious Class (A);
The Chronically Infectious Class (I);
The class undergoing treatment (T); and
The Removed class (R).
Susceptible class S consists of individuals who have yet to come in contact with the virus but are still capable of contracting the disease. Vaccinated class V consists of people who have been vaccinated. The exposed class E consists of individuals who are in their latent period of infection. This implies that they are the ones that have been infected with the virus but are incapable of spreading the virus. Q Quarantine class consists of people who are already infected and are then isolated for a specified duration of 14 days to prevent the spread of the disease and ensure the safety of people. The Asymptomatically Infectious Class A contains individuals who are infected but do not show any noticeable symptoms of the Covid-19 virus and are capable of infecting the susceptible class. Chronically infectious class I consists of people who have tested positive for the Covid-19 virus, as the symptoms clearly show. The Treatment class T compartment contains people who are infected and infectious undergoing treatment. The removed class R are those individuals that are permanently immune to the disease (either as a result of the vaccine or recovery while in the acute stage of the disease). According to [10], the following system of differential equations can be obtained from Figure 1:


From equation (2a) the Susceptible compartment, people are recruited at a rate of Λ , there is an interaction with compartments Asymptomatic, Infectious and people on treatment, which is called the force of infection at the rate of λ1 ,η is the transmission rate from Susceptible to Vaccinated people, and μ is the natural death rate of Susceptible people. People in the quarantine compartment who do not show symptoms are transferred back to the susceptible compartment at a rate of σ (1−θ )Q , while people who recover but over time lose immunity get reinfected again and go back to the susceptible compartment at a rate of φ . From equation (2b) (vaccination compartment), susceptible people enter this compartment at a rate of η while λ2 exits the compartment into the exposed compartment and the natural death μ . From equation (2c) (the exposed compartment), susceptible and vaccinated people enter this compartment at the rate of λ1 and λ2 respectively, while some individuals exit the exposed compartment and enter into quarantine, Asymptomatic and Infectious compartments at the rate of 1 α1, α2 , and α3 respectively and of course natural death μ .
Table 1:Description of variables and parameters in the Model.

Mathematical Analysis
Boundedness of the Solution

Theorem 1. There exists a domain in D in which the set of solutions {S,V, E,Q, A, I,T, R}is contained and bounded [11].
Proof. Given the solution set {S,V, E,Q, A, I,T, R}
N = S +V + E +Q + A+ I +T + R The total derivatives of the human population are given by:

Therefore, substituting (2a) − (2h) in (4) we obtain dN/dt as;

Solving (6) using integrating factor method [12], we first of all
find our integrating factor
(I.F) as follows:

Thus, all the solutions of the population are confined in the feasible region D. This shows that the solution of model (2) exists and is given by

Non-Negativity of Solution
Theorem 2. Given the initial data

after including integrating factor we have,

Hence, V (t ) ≥ 0 for all time t > 0
From (2c) of the model we have the following:

Hence, E(t) ≥ 0 for all time t > 0 .
From (2d) of the model we have,

Hence, A(t ) ≥ 0 , for all time t > 0 .
From (2f) of the model we have,

Hence, R(t ) ≥ 0 , for all time t > 0 .
Therefore, the solution (S, V, E, Q, A, I, T, R) of the Covid-19 reinfection model (2) with the initial conditions of non-negativity (11), (14),
(15), (17), (19), (21), (23), (25) in the feasible region D remains non-negative in D for all t, t > 0 .
The Existence of the Disease-Free Equilibrium Point (DFE) of the Covid-19 Reinfection model
The disease-free Equilibrium is the steady-state where there is no Covid-19 virus disease in the population [14]. Before an infectious individual was introduced into the population, we have only the susceptible present. Hence, let the Covid-19 reinfection Free Equilibrium of the SVEQAITR model be denoted by P0 such that P0 = (S0 ,V 0 , E0 ,Q0 , A0 , I 0 ,T 0 , R0 )

and equation (2b) becomes,

Hence, Covid-19 reinfection Disease Free Equilibrium is:

The Basic Reproduction Number (R0 ) of the SVEQAITR Covid 19 Reinfection Model
The basic reproduction number R0 , is defined as the average number of secondary infections caused by a
typical infectious individuals in a completely susceptible population. Calculation of the basic reproduction number R0 of the Covid-19 reinfection model can be obtained through the next-generation matrix method described by
Theorem 3. The Basic Reproduction number for SVEQAITR model is given by

where β1 ,α1 ,α2 ,α3 and are as defined in Table 1
Proof. Let X be the set of all disease compartments, that is, X = (E,Q, A, I,T ) because at this stage it is assumed that the disease has entered the system and is now in circulation, such that the SVEQAITR model can be written as;

which is the rate of appearance of new infections in each compartment. Specifically, it is the rate at which new infections enter a compartment and when transformed we have

which is the next-generation matrix that describes how infections spread across different compartments. Also,

which is called a vector that describes different transition rates for different infected states. And when transformed we have:

which represents the transition dynamics of infected individuals? It accounts for recovery, death, or movement between compartments. In the next-generation matrix method, V is used to compute R0 as the dominant eigenvalue of FV −1 . Therefore, the inverse of V becomes:


To get the eigenvalue at the disease-free equilibrium point for
FV −1 we use the Lagrangian function
| FV −1 −λ I | = 0 to obtain: 1
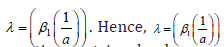 is the
spectral radius of the next generation matrix, also known as the
basic reproduction number, R0 for SVEQAITR Covid-19 reinfection
model. The basic reproduction number R0 for the SVEQAITR
COVID-19 reinfection model is given by:
is the
spectral radius of the next generation matrix, also known as the
basic reproduction number, R0 for SVEQAITR Covid-19 reinfection
model. The basic reproduction number R0 for the SVEQAITR
COVID-19 reinfection model is given by:

When R0 is less than one, it implies that the disease will die out with time, but when R0 is greater than one, the disease will persist as time goes on [15].
Discussion
The Basic reproduction number R0 quantifies the average number of secondary infections generated by a single symptomatic infectious individual in a completely susceptible population. Crucially, for the reinfection of COVID-19 to be controlled and ultimately eliminated from the population, the condition R0 must be satisfied. When R0 , each infected individual, on average, infects less than one other person, leading to a decline in new cases and eventual extinction of the disease. The basic reproduction number for the SVEQAITR COVID-19 reinfection model indicates that the spread of infection is directly proportional to the transmission rate of symptomatic individuals (β1 ) and inversely proportional to the total rate at which exposed individuals transition out of the latent state. These transition rates include movement into quarantine (α1 ) , progression to asymptomatic (α2 ) or symptomatic infection (α3 ) , and natural mortality (μ ) . To maintain 0 R <1, which is necessary for disease control, it is essential to reduce the transmission rate and enhance the rates at which exposed individuals are removed from the chain of transmission.
Comparison with other existing Literature
The basic reproduction number derived from the SVEQAITR COVID-19 reinfection model highlights the influence of the symptomatic transmission rate and the speed at which individuals exit the exposed class. Unlike the classic SEIR model, where R0 = β /γ represents a simpler view of infection and recovery, the SVEQAITR framework provides a more detailed picture by incorporating multiple exit routes from exposure (quarantine, asymptomatic, symptomatic, and death) and explicitly modeling reinfection and vaccination dynamics. Compared to existing models in the literature, such as those of [16-18] which extend the SEIR model to account for asymptomatic spread and nonpharmaceutical interventions, the SVEQAITR model advances these efforts by explicitly capturing reinfection risks and incorporating quarantine and vaccination as distinct compartments. This allows for a more realistic representation of the long-term transmission of COVID-19.
Limitation of the Model
The model assumes constant transmission and transition rates, which may not reflect real-world fluctuations due to evolving public behavior, policy changes, or viral mutations.
Recommendation for Future Work
Future extensions of the model should incorporate time-dependent parameters and population heterogeneity (e.g., age structure or regional contact patterns) to better capture the dynamic and diverse nature of COVID-19 transmission.
Conclusion
This study focused on calculating the basic reproduction number R0 for the SVEQAITR epidemic model of COVID-19 reinfection using the next generation matrix method. Our analysis helps explain how the disease spreads by considering different groups, including susceptible, vaccinated, exposed, quarantined, asymptomatic, infected, treated, and recovered individuals. The results show how vaccination, quarantine, and treatment influence reinfection rates. By studying the next-generation matrix, we identified the conditions that determine whether the disease will continue spreading or die. Our findings emphasize the importance of reducing R0 below one to effectively control the epidemic. Future studies could improve this model by adding factors such as randomness, location-based differences, or changing conditions over time. The mathematical approach used here provides useful information for health officials and researchers working to prevent COVID-19 reinfection.
Disclaimer (Artificial Intelligence)
The author(s) hereby declare that NO generative AI technologies such as large language models (ChatGPT, COPILOT, etc.) and text-to-image generators have been used during writing or editing of manuscripts.
Competing Interests
The authors have declared that there are no competing interests.
References
- Bubar M, Kyle R, Kissler SM, Lipsitch M, Cobey S, et al. (2021) Model-informed COVID-19 vaccine prioritization strategies by age and Science 371(6532): 916-921.
- Yang J, Li J, Yuan F, Fan S, Tian J (2025) The impact of COVID-19 pandemic on reported notifiable infectious diseases in China: An interrupted time series American Journal of Infection Control 53(3): 340-347.
- Bernoulli D (1760) A pioneer of epidemiological modeling in book: A Historical Introduction to Mathematical Modeling of Infectious Diseases PP: 1-20.
- Nwagwu GC, Nwobi FN (2025) A Deterministic Approach to Analyze COVID-19 Re-infection Using a Susceptible Vaccination Exposed Quarantine Asymptomatic Infectious Treatment and Recovered (SVEQAITR) Asian Journal of Probability and Statistics 27(3): 188-200.
- Hethcote HW (2000) The Mathematics of Infectious Journal of Society for Industrial and Applied Mathematics 42(4).
- Abudunaibi B, Liu W, Zhinan Guo, Zeyu Zhao, Rui J, et al. (2023) A comparative study on the three calculation methods for reproduction numbers of COVID-19. Front Med 9: 1079842.
- Diekmann O, Heesterbeek JA, Metz JA (1990) On the definition and the computation of the basic reproduction ratio R 0 in models for infectious diseases in heterogeneous populations. Journal of Mathematical Biology 28(4): 365-382.
- Driessche VDP, Watmough J (2002) Reproduction number and sub-threshold endemic equilibrium for compartmental models of disease transmission. Mathematical Biosciences 180: 29-
- Venkatesh V, Weng Q, Rai A, Maruping LM (2023) Guidelines for the Development of Three-Level Models: Bridging Levels of Analysis and Integrating Contextual Influences in IS Re- Journal of the Association for Information Systems 24(1): 65-106.
- Murray JD (2001) Mathematical I. An introduction. Springer, 3rd ed.
- Daniel J (2020) Education and the COVID-19 PROSPECTS 49: 91-96.
- McDonald GS (2004) Differential equation Integrating factor method. Plato promoting physics learning and teaching opportunities PP: 1-28.
- Abioye AI, Olumiyiwa PJ, Ogunseye HA, Oguntolu FA, Oshinubi K, et al. (2021) Mathematical Model of COVID-19 in Nigeria with Optimal Results Phys 28: 2211-3797.
- Zou L (2010) Stability analysis of disease-free equilibrium in epidemic Applied Mathematics letters 23(4): 441-444.
- Okyere EFT (2016) Fractional order SIR Model with Constant British Journal of Mathematics and Computer Science 14(2): 1-12.
- Atifa A, Khan MA, Iskaova K, Al-Duais FS, Irshad A (2022) Mathematical Modeling and Analysis of the SARS-COV-2 disease with Comput Biol Chem 98: 1-8.
- Li Q, Guan X, Wu P, Wang X, Zhou L, et al. (2020) Early transmission dynamics in Wuhan, China, of novel coronavirus–infected N England Journal of Medicine 382(13): 1199-1207.
- Ngonghala CN, Taboe HB, Salako KV, Tison JM, Kakai RG (2020) Predicting COVID-19 spread in the face of control measures in West Journal of Mathematical Biosciences Volume 328: 108431.
-

This work is licensed under a Creative Commons Attribution-NonCommercial 4.0 International License.