 Case Report
Comparison Between Two Estimators of COVID-19 Case Fatality Rate over Time: Missouri as a Case Study
Abdelmonaem Jornaz* and Jawad Sadek
Department of Mathematics and Statistics, Northwest Missouri State University, Maryville, USA
Abdelmonaem Jornaz, department of Mathematics and Statistics, Northwest Missouri State University, Maryville, USA.
Received Date: June 04, 2021; Published Date: July 12, 2021
Abstract
Coronavirus is part of a family of different viruses. A new member of this family was identified in Wuhan, China in December 2019. This novel coronavirus is called Coronavirus Disease of 2019 (COVID-19) which has spread around the world within a few months. The case fatality rate (CFR) of this disease was estimated by constructing the slope of the simple linear regression and compared with the epidemiological measure of the case fatality rate. The data analysis showed that the regression slope estimates of Missouri for the last day was 1.45% (95% CI: 1.43% – 1.46%) comparing with 1.58% for the basic formula. Over time, the results showed that the difference between the two estimators was very small, it was below 1%, but the regression slope estimate was more robust than the epidemiological measure of the case fatality rate, especially in the early stages.
Keywords: COVID-19; Case fatality rate; Simple linear regression
Introduction
In March 11, 2020, the World Health Organization (WHO) declared the novel coronavirus, COVID-19, a global pandemic. It was about two months after the novel coronavirus identified in Wuhan, China [1].
One of the important mortality measurements in epidemiology is the case fatality rate (CFR) which refers to the probability, proportion, of deaths from specified diseases among the total number of confirmed cases during a specified time period. The basic formula that used to calculate the CFR is [2].
CFR (%) = (Number of deaths)/ (Number of cases) ×100%
This estimator is also known as a Naïve estimator because it misleads the results as some biases may affect it.
One of the common biases is the delay in the reporting of the deaths, and so some of the deaths count as diagnosed cases. Lipsitch et al. described two forms of bias that may affect the CFR estimate, and discussed reducing those baises [3]. To remedy the biases, some complicated approaches were developed to estimate the CFR. Ghani et al. proposed a new approach based on the Kaplan-Meier survival procedure [4]. Gebreyesus and Chang developed a new algorithm to estimate CFR, the new algorithm combines the Naïve estimate and linear regression model (NELM) [5]. The simple linear regression slope has been used to estimate the CFR of COIVD-19 in some regions such as mainland China [6], Nigeria [7], and the Philippines [8]. It was also used to compare the CFR of Turkey with other European countries [9]. The aim of this study is to compare the regression slope with the epidemiological measure of the case fatality rate over daily reported data and evaluate the simple linear regression as an alternative measure to estimate CFR of COVID-19 for Missouri.
Data Source
The Daily number of COVID-19 confirmed cases and the daily number of COVID-19 mortality have been gathered and made public by different agencies. The data in this study are from The New York Times’ site 03/07/2020 to 06/02/2021 [10]. The number of confirmed cases of COVID-19 in the area was considered as the explanatory variable and the number of COVID-19 deaths as the dependent variable [11].
Methods
Linear regression is a widely used statistical approach to explore the association between dependent variable and one or more explanatory variables. In case of one explanatory variable, the approach is known as a simple linear regression (SLR). The simple linear regression model is written as where y is the dependent variable, x is the explanatory variable, a is the intercept, b is the slope, and e is the error term (residual). The slope of the linear regression model is used as the case fatality rate. This technique proved to be simple and useful in the sense that it does not require complex parameter assumptions as in the case of transmission models [9]. In addition, this method is found to be accurate in the early onset of the disease. Furthermore, parameters such the impact of patients’ incubation time, duration of the disease, hospitalization time and other factors can be adjusted by the intercept only of the fitted line so that the slope remains unchanged [9].
Results
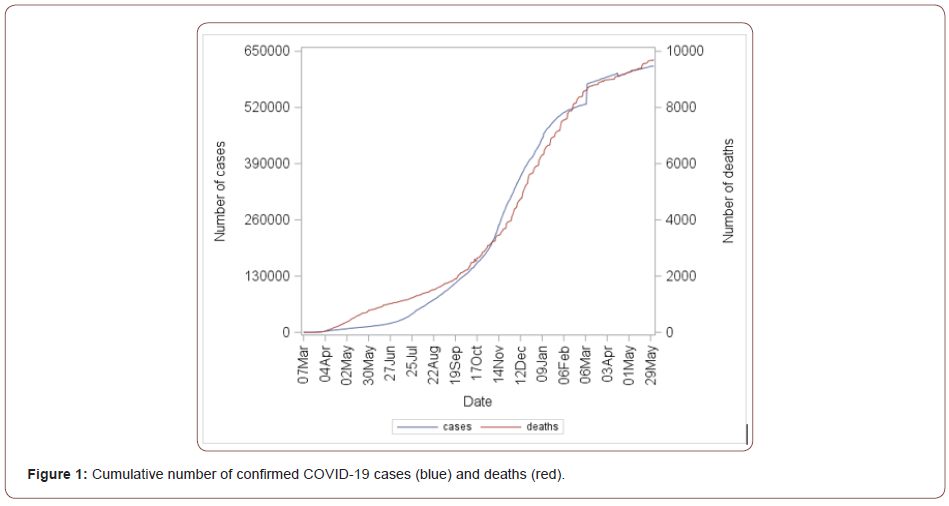
On March 7, 2020, the first positive coronavirus case in Missouri was reported in St. Louis County, and the first covid-19 death in Missouri was reported on March 18, 2021, in Boone County. (Figure 1) shows the trend of the cumulative number of confirmed cases and deaths in Missouri. The slope of the simple linear regression was used as the epidemiological measure of the case fatality rate, the following figure and table show the results of the linear regression analysis.

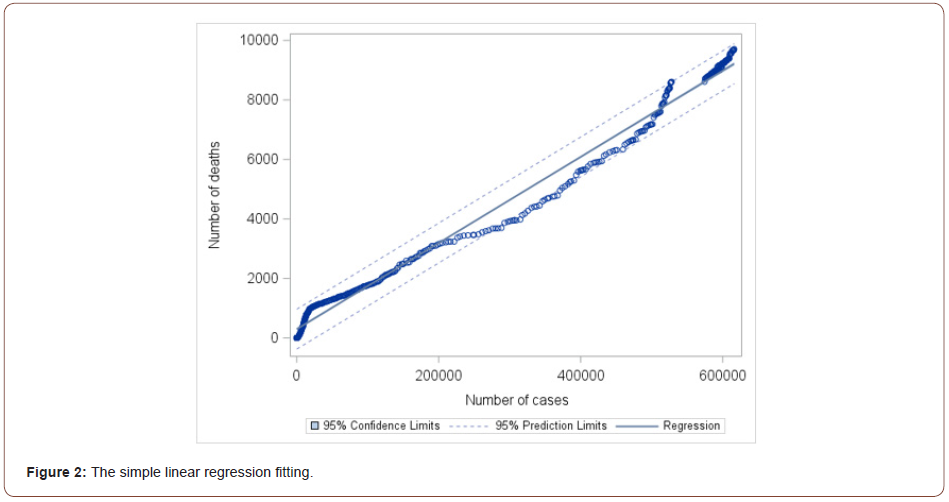
Figure 2 presents the simple linear regression results between cumulative confirmed cases and the cumulative deaths. There is a strong linear association between the cumulative confirmed cases and deaths of Missouri (Table 1).
Table 1: The simple linear regression estimation in Missouri.

The regression results showed that the estimated slope for COVID-19 in Missouri was 1.45% (95% CI: 1.43% – 1.46%) and the coefficient of determination was 99.02% which means that the number of cases can explain about 99% of the variability in the number of deaths. Table 2 shows the comparison between the estimated basic (Naïve) formula and the simple linear regression slope of the CFR for the last day of the dataset. Moreover, the difference between the two estimators for the last day in the data was calculated and it showed that the difference was very small, only about 0.13%. The daily CFR was calculated by dividing the cumulative number of deaths by the cumulative number of cases for each day. Similarly, the simple linear regression slope was calculated for each day using the cumulative data up to that day.

Table 2: Comparison between the Naïve and slope estimator for case fatality rate (CFR) in Missouri.

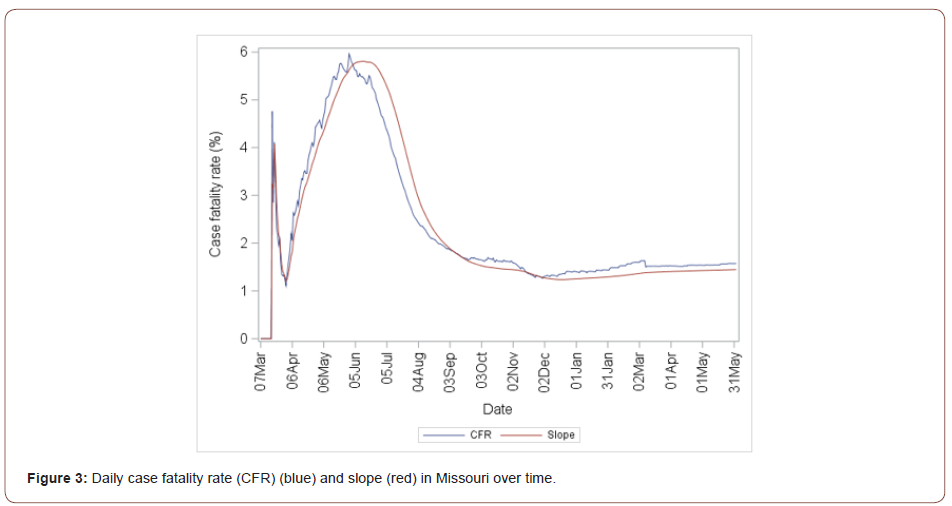
Figure 3 shows that the CFR of Missouri hit the peak on 05/30/2020 after about three months the first positive case was reported. The two estimators were very close to each other in the early stages up to the peak point, then the slope descended slowly compared to the CFR because the slope uses the past data whereas the CFR uses only the daily data. In addition, the slope is smoother than the CFR which can made it a better estimator in the early stages.

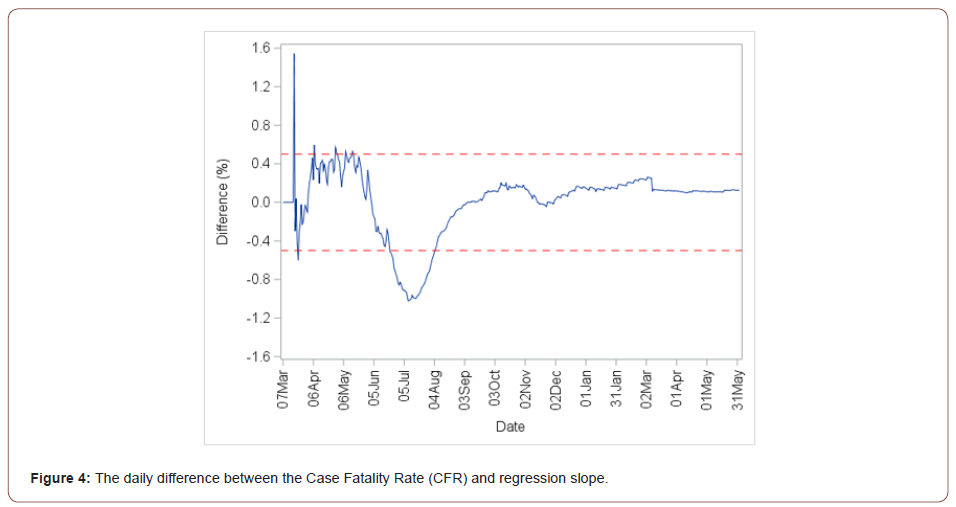
Figure 4 shows that highest difference between the two estimators was about 1% on July 9. Note that the difference at the first reported death was higher because the slope used zero for the previous days, so it was lower than what it should be. In addition of estimating the CFR, the simple linear regression model can be used to forecast the deaths of the following day or days. To do so, the first lag of the confirmed cases can be used instead of the actual confirmed cases to predict the deaths of the following day.

Conclusion
The coronavirus pandemic has affected the whole world. The CFR of Missouri hit its peak after about three months of its first reported case. When comparing between the two estimates, the regression slope is found to be more robust than the Naïve estimate, especially in the early stages. Delay in the reporting of deaths does not affect the regression slope because it considers the cumulative confirmed cases and deaths over time. However, delay in reporting can affect the Naïve estimate because it uses day by day reporting. Although the cumulative confirmed cases helped keep the regression slope smooth, it compelled the slope to descend slowly after the peak point. Moreover, the regression model can be used to forecast the deaths of the next day or days. Finally, there wasn’t a notable difference between the two estimators over time. In the Missouri case study, the highest calculated difference was about 1%.
Acknowledgement
None.
Conflict of Interest
The authors have no financial interests or conflict of interests to report.
References
- World Health Organization (WHO). WHO Timeline – COVID-19.
- Friis RH (2018) Epidemiology In: 2nd (edn.), MA: Jones & Bartlett Learning, Burlington, USA, pp. 101.
- Lipsitch M, Donnelly CA, Fraser C, Blake IM, Cori A, et al. (2015) “Potential Biases in Estimating Absolute and Relative Case-Fatality Risks during Outbreaks”. PLoS Negl Trop Dis 9(7): 479-486.
- Ghani AC, Connelly CA, Cox DR, Griffin JT, Fraser C, et al. (2005) “Methods for Estimating the Case Fatality Ratio for a Novel, Emerging Infectious Disease”. Am J Epidemiol 162(5): 479-486.
- Gebreyesus KD and Chang C (2016) “A new computational algorithm to estimate case fatality rate.” International Conference of Computational Statistics and Data Engineering WCE2016.
- Yang S, Cao P, Du P, Wu Z, Zhuang, Z, et al. (2020) "Early estimation of the case fatality rate of COVID-19 in mainland China: a data-driven analysis." Ann Transl Med 8(4):128.
- Suleiman AA, Suleiman A, Abdullahi UA, Suleiman SA (2020) “Estimation of the case fatality rate of COVID-19 epidemiological data in Nigeria using statistical regression analysis.” Biosaf Health 3(1): 4-7.
- Medina MA (2020) “Preliminary estimate of COVID-19 case fatality rate in the Philippines using linear regression analysis.” Social Science Research Network- electronic journal.
- Öztoprak F and Javed A (2020) “Case fatality rate estimation of COVID-19 for European countries: Turkey’s current scenario amidst a global pandemic; comparison of outbreaks with European Countries.” Eurasian Journal of Medicine and Oncology 4(2): 149-159.
- HUMANITARIAN DATA EXCHANGE (HDX).
- Population Projections: States 1995–2025.
-
Abdelmonaem Jornaz, Jawad Sadek. Comparison Between Two Estimators of COVID-19 Case Fatality Rate over Time: Missouri as a Case Study. 4(3): 2021. ABBA.MS.ID.000589. DOI: 10.33552/ABBA.2021.04.000589.
COVID-19, Case fatality rate, Simple linear regression, statistical approach, Incubation time, epidemiological measure
-

This work is licensed under a Creative Commons Attribution-NonCommercial 4.0 International License.


