 Mini Review
Absolute Dpcr Quantification of Micrornas by Absolute Dpcr for the Diagnostic Screening of Colon Cancer
Farid E Ahmed, Department of Research in Biotechnology, USA.
Received Date: February 18, 2019; Published Date: February 27, 2019
Introduction
Colorectal cancer (CRC) is the third most common malignancy worldwide, with an estimated one million new cases and half million deaths yearly. Screening for CRC allows early stage diagnosis of malignancy and potentially reduces disease mortality. The convenient and inexpensive fecal occult blood test (FOBT) screening test has low sensitivity and requires dietary restriction, which impedes compliance. Although colonoscopy. Is the golden screening standard for the for this cancer, the invasive nature, abdominal pain and high cost have hampered worldwide application of this procedure. A noninvasive sensitive screen for colon cancer (CC) requiring no dietary restriction is a more convenient test. CC is more abundant in the USA than rectal cancer (RC).
The discovery of small non-coding protein sequences, 17- 27 nucleotides long RNAs (such as microRNAs), has opened new opportunities for a non-invasive test for early diagnosis of many cancers. MiRNA functions seem to regulate development and apoptosis, and specific miRNAs are critical in oncogenesis, effective in classifying solid and liquid tumors, and serve as oncogenes or suppressor genes. MiRNA genes are frequently located at fragile sites, as well as minimal regions of loss of heterozygosity, or amplification of common break-point regions, suggesting their involvement in carcinogenesis. Profiles of miRNA expression differ between normal tissues and tumor types, and evidence suggests that miRNA expression profiles can cluster similar tumor types together more accurately than expression profiles of protein-coding mRNA genes. Although exosomal RNA are missed, a parallel carried out on stool miRNAs to compare the extent of loss when colonocytes are only used can be carried out, and an appropriate corrections for exsosomal loss can be made. To ascertain the validity of a miRNA screening test for CC, it must be validated in a study, using a nested case control epidemiology design and employing a prospective specimen collection, retrospective blind evaluation (PRoBE) of control subjects and test colon cancer patients, as delineated by NCI’s Early Detection Research Network (EDRN) http://edrn.nci. nih.gov. Immunoparamagnetic are employed to capture colonocytes from harsh stool environment, whose extracted fragile total small RNA is stabilized shortly after stool excretion by commercial kits so it does not ever fragment, followed by standardized analytical quantitative miRNA dPCR-chip profiling in noninvasive stool samples, to develop a panel of few stable miRNAs for absolute quantitative diagnostic screening of early sporadic colon cancer (stage 0-1), more economically and with higher sensitivity and specificity than other CC screening test on the market today.
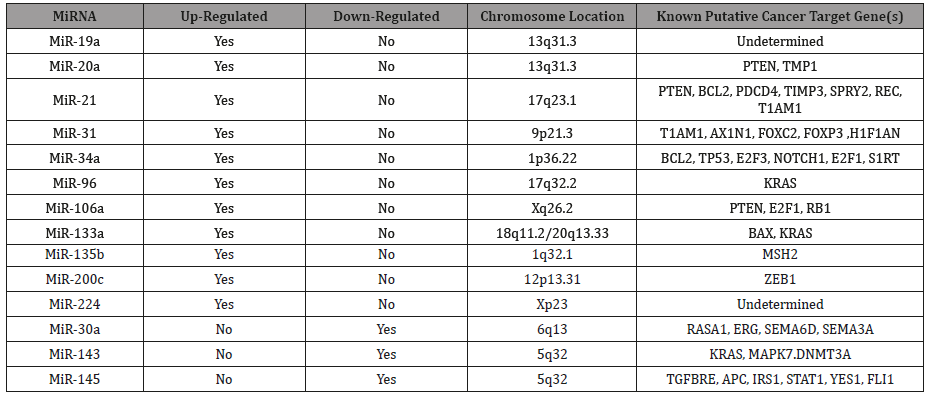
Table 1: Characteristics of Fourteen Up- or Down-Regulated MicroRNAs in Human Stool.

A preliminary global microarray expression analysis using an exfoliated colonocytes enrichment strategy, which employed control subjects and various stages (0-4) of CC, using Affymetrix Gene Chip miRNA 2.0 Array, showed 180 preferentially expressed miRNA genes that were either increased (124 miRNAs), or reduced (56 miRNAs) in expression in stool samples from CC patients. This allowed careful selection of 14 miRNAs (12 Up-Regulated, miR-19a, miR-20a, miR-21, miR-31, miR-34a, miR-96, miR-106a, miR-133a, miR-135b, miR-206, miR-224 and miR-302; and 2 Down-Regulated, miR-143 and miR-145) Table 1 for further PCR analysis (Table 1).
Then analysis carried out using absolute miRNAs expression by a chip-based digital PCR by partitioning a sample of DNA or cDNA into many individual, parallel PCR reactions; some of which contain the target molecule (positive), while others do not (negative). A single molecule can be amplified a million-fold or more. During amplification, TaqMan chemistry with dye-labeled probes is used to detect sequence-specific targets. When no target sequence is present, no signal accumulates. Following dPCR analysis, the fraction of negative reactions is used to generate an absolute count of the number of target molecules in the sample, without the need for standards or endogenous controls. In conventional qPCR, the signal from wild-type sequences dominates and obscures the signal from rare sequences. By minimizing the effect of competition between targets, dPCR overcomes the difficulties inherent to amplifying rare sequences and allows for sensitive & precise absolute quantification of the selected miRNAs. Applied Biosystem Quant Studio™ 3D instrument only performs the imaging and primary analysis of the digital chips. The chips themselves must be cycled offline on a Dual Flat Block Gene Amp® 9700 PCR System or the ProFlex™ 2x Flat PCR System. The Quant Studio™ 3D Digital PCR System (Figure 1) can read the digital chip in less than 1 minute, following thermal cycling (Figure 1).

1. Chip Case Lid- The lid used to seal the Digital PCR 20K Chip for thermal cycling and imaging on the Quant StudioTM 3D Instrument.
2. Digital PCR 20K Chip- The 10-mm2 consumable that contains the 20,000 reaction wells, which suspend the individual PCR reactions for thermal cycling and imaging.
3. Quant StudioTM 3D Digital PCR Chip Case- The thermal -conductive base that secures and protects the Digital PCR 20K Chip during all phases of use.
4. Chip ID- A label applies to the Quant StudioTM 3D Digital PCR chip Case Lid that can be used to uniquely identify the chip to which it is applied.
5. Fill Port- The aperture within the Chip Case Lid through which immersion Fluid is injected on to the Chip.
6. Reaction Wells- The 20,000 physical holes within the Digital PCR 20K Chip that suspend the individual PCR reaction.
The current Quant Studio™ 3D Digital PCR Chip allows for one sample per chip; although, duplexing allows for analysis of two targets per chip. Sample prep for digital PCR is no different than for real-time PCR, when using the Quant Studio™ 3D Digital PCR System. The concentration of cDNA stock can be estimated by including all of the necessary dilution factors into the Analysis Suite™ software, which gives the copies/μL in the stock. A critical step in dPCR, is sample partitioning [i.e., division of each sample into thousands of discrete subunits prior to amplification by PCR, each ideally containing either zero or one (or at most, a few) template molecules]. Each partition behaves as an individual PCR reaction –as with real-time PCR—fluorescent FAM probes [or others, as VIC fluorescence. Samples containing amplified products are considered positive (1, fluorescence), and those without product –with little or no fluorescence are negative (0, fluorescence). The ratio of positives to negatives in each sample is the basis of amplification. Unlike real-time qPCR, dPCR does not rely on the number of amplification cycles to determine the initial amount of template nucleic acid in each sample, but it relies on Poisson Statistics to determine the absolute template quantity. The unique sample partitioning step of dPCR, coupled with Poisson Statistics, allows for higher precision than both traditional and qPCR methods; permitting for analysis of rare miRNA targets. The use of a nanofluidic chip provides a convenient mechanism to run thousands of PCR reactions in parallel. Each well is loaded with a mixture of sample, master mix, and Applied Biosystems TaqMan Assay reagents are individually analyzed to detect the presence (positive) or absence (negative) of an endpoint signal. To account for wells that may have received more than one molecule of the target sequence, a correction factor is applied using the Poisson model. It features a filter set that is optimized for the FAM™, VIC®, and ROX™ dyes, available from Life Technologies.
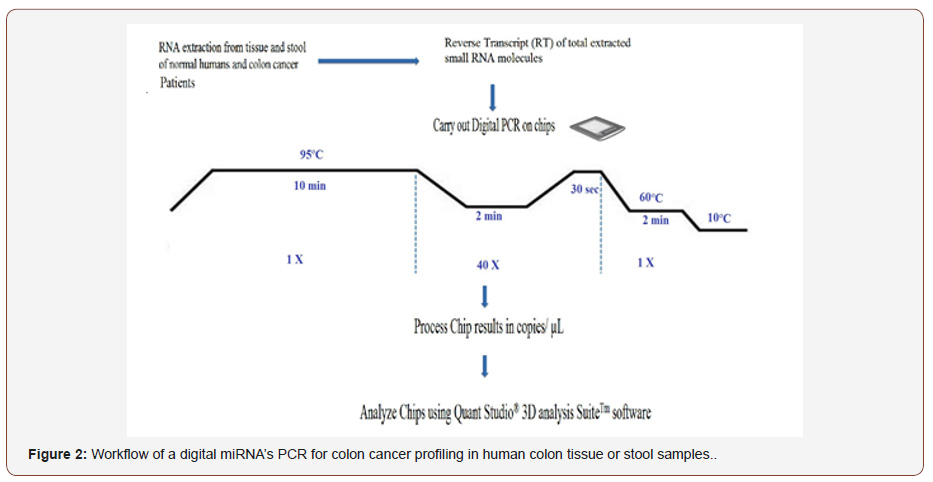
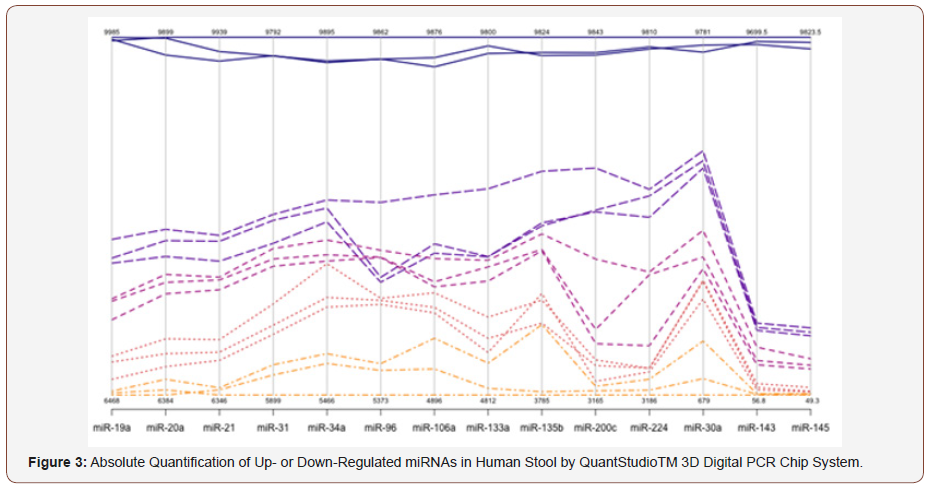
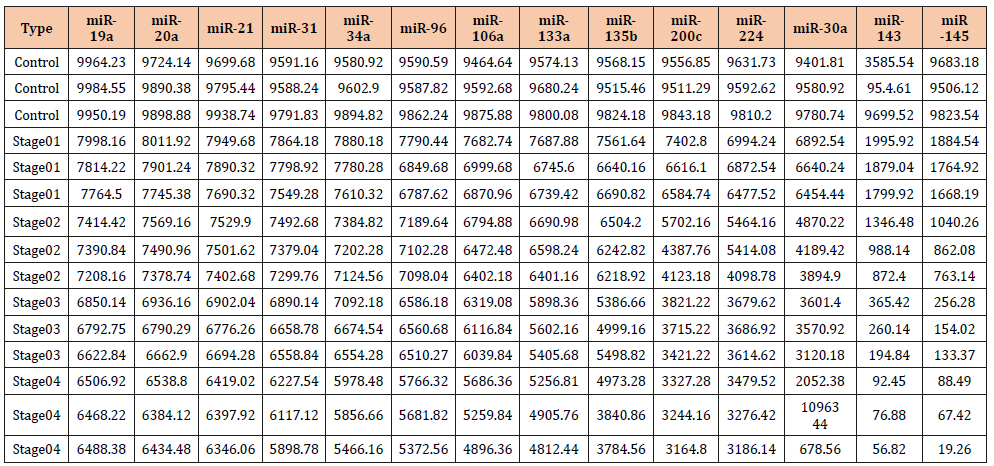
Absolute quantification of the 14 miRNAs is shown in Table 2, and Table 3 is a representation of SDs and R2 for the 14 miRNAs tested by absolute digital PCR. (Figure 2) is Workflow of a digital miRNA’s PCR for colon cancer profiling in human colon tissue or stool samples. (Figure 3). is a graphical representation of the absolute quantification of the 12 up- or 2 down-regulated miRNAs in Human Stool by the QuantStudioTM 3D Digital PCR Chip System. Digital PCR, however, needs a rough estimate of the concentration of miRNAs of interest to carry out first , in order to make appropriate dilutions; Non-template controls and a RT negative control must be set up for each miRNA, when using a “primer pool method” for retro-transcription; a chip-based dPCR method requires less pipetting steps, which reduces potential PCR contamination, and Quant StudioTM 3D chip has 20,000 fixed reaction wells, which reduces variability of dPCR results (Figure 2 & 3 and Table 2 & 3).


Table 2: Absolute Quantification of Up-/Down- Regulated miRNAs in Stool by Quant Studio TM 3D Chip Based Digital PCR.

Table 3: Representation of SDs and R2 for miRNAs tested by absolute digital PCR.

To avoid bias and ensure that biomarker selection and outcome assessment will not influence each other, a prospective specimen collection retrospective blinded evaluation (PRoBE) design randomized selection could be employed. An enrichment and exfoliation strategy of colonocytes from stool for miRNA profiling using Dynal superparamagnetic polystyrene beads coated with a mouse IgG1 monoclonal antibody (Ab) Ber-Ep4, specific for an epitope on the protein moiety of the glycopolypeptide membrane antigen Ep-CAM, which is expressed on the surface of colonocytes and colon carcinoma cells, can be used. Comparing the Agilent electrophoretic (18S and 28S) patterns to those obtained from total RNA extracted from stool, and differential lysis of colonocytes by RT lysis buffer (Quagen), could be construed as a validation that the electrophoretic pattern observed in stool (18S and 28S) is truly due to the presence of human colonocytes, and not due to stool contamination with Escherichia coli (16S and 23S). While some exsosomal RNA can be released from purified colonocytes into stool, correction for that effect can be made. Hence, for CRC screening, miRNA markers are more comprehensive and preferable to a DNA-, epigenetic-, mRNA- or a protein-based marker. An added advantage of the use of the stable, nondegradable miRNAs by PCR expression, or chip-based methods is being automatable, making them more economical and acceptable by laboratory personnel performing these assays.
Stool testing has several advantages over other colon cancer screening methods as it is truly noninvasive and requires no unpleasant cathartic preparation, formal health care visits, or time away from work or routine activities. Unlike sigmoidoscopy, it reflects the full length of the colorectum and samples can be taken in a way that represents the right and left side of the colon. It is believed that colonocytes are released continuously and abundantly into the fecal stream, contrary to blood that is released intermittently as in guaiac FOBT; therefore, this natural enrichment phenomenon partially obviates the need to use a laboratoryenrichment technique to enrich for tumorigenic colonocytes, as for example when blood is used for testing. Furthermore, because testing can be performed on mail-in-specimens, geographic access to stool screening is essentially unimpeded. Results have show that even the presence of bacterial DNA, non-transformed RNA and other interfering substances in stool does not interfere with measuring miRNA expression, when an enrichment method such as the immunological paramagnetic capture method is used, and when appropriate PCR primers are employed. Besides, stool colonocytes contain much more miRNA than that available in free circulation such as in plasma.
Routine extraction of total small RNA from Stool Samples can be carried out using commercial RNA extraction preparations, which provide the advantage of manufacturer’s established validation and quality control standards, increasing the probability of good results to extract high quality total RNA from an environment as hostile as stool; thus, shattering the myth that it is difficult to employ RNA as a screening substrate, as fragmented RNA results in poor cDNA synthesis and ultimately in less than optimal PCR amplification. This step is followed by reverse Transcription (RT) and preparation of single stranded copy deoxy ribonucleic acid (ss-cDNA). Compared to qPCR, dPCR clearly offers more sensitive and considerably more reproducible clinical methods that could lend themselves to diagnostic, prognostic, and predictive tests. The technology, however, needs further development to reduce cost and simplify application, and research reported with understanding of associated errors.
The term “absolute quantification” used in dPCR refers to an estimate derived from the count of the proportion of positive partitions relative to the total number of partitions and their known volume. When the sample is sufficiently dilute, most partitions will not contain template and those that do are most likely to contain single molecules. As the sample becomes more concentrated, the chance of more than 1 molecule being present within a positive partition increases. This does not pose too great of a challenge, because the distribution of molecules throughout the partitions approximates a Poisson distribution, and a Poisson correction is applied. The dynamic range of a dPCR assay can extend beyond the number of partitions analyzed but the assay precision deteriorates at each end. In contrast, qPCR precision deteriorates only at low copy numbers.
dPCR benefits from a far more predictable variance than qPCR, but dPCR is susceptible to upstream errors associated with factors like sampling and extraction. dPCR can also suffer systematic bias, particularly leading to underestimation, and internal positive controls are likely to be as important for dPCR as they are for qPCR, especially when reporting the absence of a sequence. Calibration curves are frequently employed to reduce the error associated with qPCR, but they in turn are challenging to select, value assign and apply in a manner that will be reproducible; their application also contains inherent error that is almost never considered. A key problem with applying qPCR to areas such as the discovery of biomarkers that will eventually be translated to clinical care, is understanding whether poor reproducibility is biological, or if it is due to issues related the fact the qPCR technique is difficult to perform reproducibly. Implement dMIQUE Guidelines on dPCR data analysis helps to standardize experimental protocol, maximize inefficient utilization of resources, and enhance the impact of this technology. To access test performance characteristics (PCT) of the miRNA approach, the copies/μl values of the miRNA gene panel (or a derived miRNA index, IMP) obtained from stool/colonelcy samples of normal subjects and CC patients with high sensitivity and specificity are compared to the commonly used guardian FOBT test and with endoscopy results obtained from patients’ medical records to access TPC of the miRNA approach.
False positive discovery rates (expected proportion of incorrect assignment among the accepted assignments) can be assessed by statistical methods, as it could reflect on the cost effectiveness of our test. The number of optimal miRNA genes (whether 14 or less) to achieve an optimum gene panel can be established statistically. Providing numerical underpinning of dPCR as a function of total small RNA can be ascertained by use of cytological methods on purified colonocytes, employing Papanicolaou and Giemsa staining. A known number of the colonocytes isolated from 1g stool (from normal and neoplastic preparations), extracting total RNA from them to determine the actual amount of total RNA per stool sample, and determining the average copies/μl value from the panel of selected miRNAs from dPCR using QuantStudioTM 3D Digital PCR Chip instrument, give an average value per a certain amount (pg or ng) of total RNA. Statistical methods, both parametric and non-parametric methods can be used for validating the miRNA approach. Cross-validation can be used to protect against overfitting. Bioinformatics methods can be used to correlate seed miRNA with target mRNA data.
To measure the clinical utility of gene expression testing as a screening test, the diagnostic sensitivity and specificity of the miRNA gene panel selected, or a derived PMI, can be compared to the published sensitivity and specificity of the commonly employed diagnostic screening test, guaiac FOBT, which for over 3 decades in large adenoma averaged < 12%, and in carcinoma averaged ~ 30%, and the specificity averaged ~ 95%, and to the gold screening standard “colonoscopy” results obtained from participants’ medical records that averaged 87% for sensitivity and 100% for specificity. The limitations of FOBT are biologically inescapable and cannot be reversed by technological advances. On the other hand, we can screen for per-malignant stages of CC, with > 90% sensitivity and > 95% specificity, employing 14 miRNA genes in a functional assay, which is better than any available noninvasive test. Thus, a large number of patients will be spared the discomfort, risk and expense of screening colonoscopy. Only those patients truly at risk of having CC will need to undergo colonoscopy.
Using the copies/ul results from the panel of genes selected obtained from stool samples of normal, and from stool samples of cancer patients, a 2 x 2 tables can be used to predict a miRNA index to determine the clinical sensitivity and specificity of the miRA assay from mRNAs stool specimens’ results. dPCR is the most practical, least labor-intensive and economical approach to quantify miRNA as a noninvasive diagnostic test to screen for CC, using automatic RNA extraction technology. Although other methods such as qPCR, next generation sequencing (NGS) technologies, plate assay technology to study miRNA expression, and miRNA measurements from exosomes and microvessicles extracted from stool, can provide alternate standardized methods for miRNA quantification, these methods will not be as precise, nor as economical as using dPCR technology.
Acknowledgement
I express my thanks to participating volunteers who provided stool samples for the study; Dr. Paul W. Vos of the Department of Biostatistics, East Carolina University for statistical advice, and Dr. Clark D. Jeffries at Renaissance Computing Institute, University of North Carolina at Chapel Hill for bioinformatics’ insight.
Funding for carrying out this research was provided by GEM Tox Labs Operating Funds. The author declares that there has been no conflict of interest carrying out of this research, or during data analysis.
Conflict of Interest
No conflict of interest.
-
Farid E Ahmed. Absolute Dpcr Quantification of Micrornas by Absolute Dpcr for the Diagnostic Screening of Colon Cancer. Annal Biostat & Biomed Appli. 1(4): 2019. ABBA.MS.ID.000520.
Biotechnology, Colorectal cancer, fecal occult blood test, colonoscopy, rectal cancer, heterozygosity, epidemiology design, Chip Case Lid, Digital PCR 20K Chip, Chip ID, Fill Port.
-

This work is licensed under a Creative Commons Attribution-NonCommercial 4.0 International License.


