 Research Article
Dynamics of Ontogenesis in The Phytosphere: Fluctuation of the Asymmetry of The Birch Leaf (Betula Pendula)
P. M. Mazurkin*
Peter Matveevich Mazurkin, Dr. tech. sciences, prof., Volga State University of Technology, Russia.
P.M. Mazurkin, Peter Matveevich Mazurkin, Dr. tech. sciences, prof., Volga State University of Technology, Russia.
Received Date:May 01, 2023; Published Date:June 07, 2023
Abstract
The method for measuring the morphological parameters of birch (Betula Pendula) leaves with-out cutting them in the dynamics of ontogenesis has been refined, the asymmetries and fluctua-tions of leaves have been compared, and patterns of oscillatory adaptation in the dynamics of ontogenesis have been identified. First, a sheet is selected, marked with a white thread with a tag (birch and leaf number). Before photographing, a transparent mesh (2×2 mm) is placed on the front side of the growing leaf so that the middle line along the mesh coincides with the main vein of the leaf. The palette sheet is then photographed with a digital camera with a photo stor-age function. On the computer, the photo is cropped and enlarged for measurements on the screen up to A4 format. The measured 25 accounting birch leaves were divided into groups ac-cording to the nature of their behavior in ontogenesis: 1) left asymmetry, when the left side of the leaf is predominant; 2) tendency of the accounting sheet by fluctuation from left to right asymmetry; 3) transition from left to right asymmetry; 4) transition from right to left asymmetry; 5) tendency of the growing leaf by fluctuation from right to left symmetry; 6) right asymmetry. New sheet parameters have been introduced: absolute asymmetry; relative asymmetry. The “+” sign will show left asymmetry, and the “–” sign will show right asymmetry. The wavelet signal identification method for each leaf revealed up to 6-7 quanta of behavior in ontogenesis in the form of wave equations. Birch is distributed throughout the Northern Hemisphere, so the phyto-sphere can be studied by fluctuating asymmetry of leaves in ont ogeny in different geograph-ical coordinates of the cities of the world.
Keywords:Birch; Leaves; Ontogeny; Morphoparameters; Dynamics; Patterns
Introduction
The basis of the functioning of the living shell (phytogeosphere according to Academician E. M. Lavrenko) of the Earth is the phytosphere with its inherent unique phenomenon of photosynthesis. The ecological role of plants is very important and multifaceted.
Birch occupies a special place among higher plants.
The main object of global and local environmental monitoring can be a birch with account-ing leaves without cutting them according to our 18 inventions for methods, in particular, ac-cording to patents 2589487, 2597643, 2597645, 2606189 and 2615363 for leaves in a grow-ing state. The birch forests of the Northern Hemisphere (the Holarctic kingdom according to A.L. Takhtajan [1,2] occupy half the world along the Arctic Ocean.
Asymmetry, as the main parameter of the Universe, will remain even with large numbers of leaves (one mature birch has an average of 105 leaves). Moreover, the leaf is the most sensitive and at the same time informative organ of the plant organism, reflecting the influence of changing environmental conditions [3]. The asymmetry of birch leaves must first be studied in cities. According to [4-7], studying the impact of urbanization processes on urban ecosystems should help predict possible scenarios for the development of life on Earth.
At the beginning of section 3.3. PHENOMETRY [8] clearly indicates the need to record dates: “It is desirable that when observing the course of plant development, not only the most noticeable phases (opening of leaves, the beginning of flowering, etc.) are noted, the dates of which can be easily fixed, but also daily fluctuations in growth between these phases”.
However, when conducting field experiments in phenology, the date and, moreover, the time in hours are not set on the day of the measurements. Biologists give a detailed structural analysis of the shape of the leaves, highlighting the stages of ontogeny, trying to identify the functional features of the behavior of many leaves on average from them. However, they completely ignore the main parameter of functioning - the time from the moment of the beginning of ontogenesis to the moment of leaf fall. Taking into account the time in days (physical-ly, the cycle of the Earth’s revolution around itself) would allow at the beginning of research to abandon the stages of ontogeny and consider the continuous dynamics of the development of each leaf, without taking into account the discreteness of morphogenesis in many leaves.
We see the reason for this only in one thing, when biologists have not been able to turn dates into a time scale in the dynamics of ontogeny. The prohibition on measuring the current time is clear from the phrase [9]: “With a small number of descriptions (less than 10), the derivation of averages does not make sense.” The doctrine of the arithmetic mean, at the suggestion of the great Gauss, hindered the science of the development of processes in plant ontogeny for almost 300 years.
Having expressed a breakthrough idea in his book, Schnelle F. did not provide a single table of data on measurements of the current ontogenetic time. It is noted [8] that the greening (unfolding of leaves) of a birch for the period from 1751 to 1930 near Norwik (England) occurred in 1-9 days (on average, 4 days). We note here that in 2023 the birch in the city of Yoshkar-Ola began to bud from April 20, that is, 10 days earlier (before that, the beginning of the growing season was from May 1).
The time during which the leaf performs the function of photosynthesis plays an important role in the life of the plant and the ecosystem as a whole. As a first approximation, this time is defined as the life span of the leaf. Since the time of leaf development inside a bud varies greatly between species, the lifespan of a leaf is defined as the interval between the appearance of a leaf from a bud and its abscission [10].
The fluctuation (oscillation) in the book [8] refers to the daily growth of the leaf size of a plant. Then it can be accepted that the signs of fluctuation and asymmetry can be separately attributed to the vegetative organs of plants and to the plants themselves.
The purpose of the article is to refine the method of measurements in the dynamics of on-togenesis, to compare the asymmetry and fluctuations of birch leaves without cutting them, to identify patterns of oscillatory adaptation of the counting leaf in the dynamics of ontogenesis, and to distribute the counting leaves according to the behavior into six combinations of left and right asymmetries.
We consider the relative asymmetry of the morphological parameters of birch leaves dur-ing the growing season as a natural process of oscillatory adaptation of each record sheet to changes in the external microenvironment surrounding this leaf.
Materials And Methods
Photodynamics of accounting birch leaves
Birch leaf (Betula pendula) has an oval-triangular shape, narrowed towards the end. The edges are serrated. The front side has a dark green glossy tint, and the reverse side has a matte green tint. Width is measured by the largest distance across the sheet. In measurements, it is desirable to take morphological parameters halfway along the length of the main vein near the attachment of the leaf to the petiole.
Then, in contrast to the known method [11,12], we replaced the morphological sign of the width of the leaf halves with the maximum widths ‘nb [ ;t of the halves (Figure 1). It turned out not five, but six morphological features for each record sheet.
The morphological parameters of the left and right halves of the
registration sheet in Figure 1 are as follows:
b′ , b′′ – maximum width of the left and right halves of the
sheet, mm;
h′ , h′′ – height from the base of the sheet to the maximum
width, mm;
l′æ,l′′æ – length of vein of the second order, second from the
base, mm;
l′î,l′′î – distance between the bases of the first and second
veins of the second order, mm;
l′ê,l′′ê – distance between the ends of the same veins, mm;
α ′ , α ′ – the angle between the main vein and the second vein
from the base of the leaf of the second order, о.
The methodology for experiments on living counting leaves without cutting them is given in the textbook [13]. Measurements are carried out in two stages: a) photographing the accounting leaves with a palette; b) on the computer screen, the procedure for measuring 12 morphological parameters.
After that, the calculation results are placed in an Excel spreadsheet, and then regularities are identified in the CurveExpert-1.40 software environment. The method of photodynamics of accounting leaves according to the scheme in Figure 1 is given in [14]. First, a sheet is selected, which is marked with a white thread with a tag (birch and leaf number). Then this selected sheet becomes an accounting sheet, on which, after a few days, photographs are taken with a cell phone.
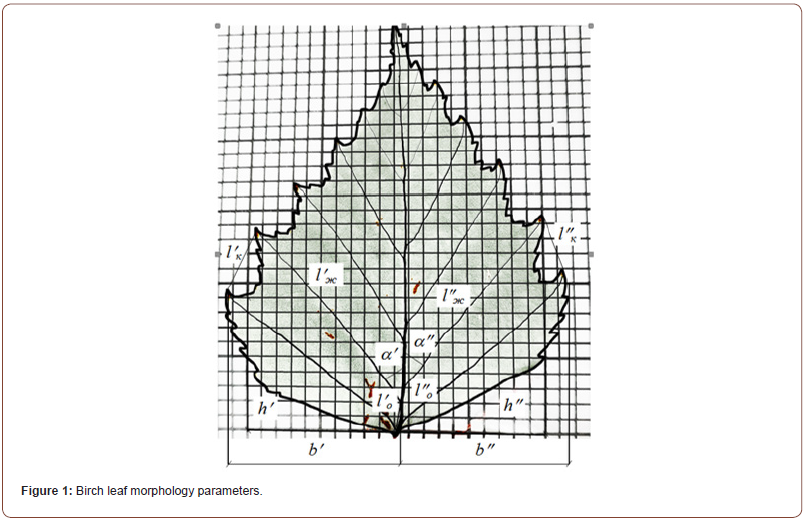
For constancy of the influence of the time of day, photography was carried out at approx-imately 15:00 in the afternoon. Before photographing, a transparent palette with a grid (2 × 2 mm) is placed on the front side of the growing record sheet so that the middle line along the palette coincides with the axis of the longitudinal main vein of the record sheet. On the re-verse side of the sheet is a white substrate, for example, a piece of whatman paper or card-board. The palette sheet is then photographed with a digital camera with a photo storage func-tion.
On the computer, the photo is cropped and enlarged for measurements up to A4 format.
Up to 25 leaves from five birch trees are sufficient for photodynamics and subsequent laboratory measurements [13]. This provides a measurement error of 1%. Such a small level of error is achieved by the fact that after enlarging the photo-graph to A4 format and carrying out measurements on the screen with a millimeter ruler and a protractor, the results are multiplied by the scale of each photograph. The actual data on the parameters of the morphology of the count sheet at a given time of vegetation are obtained by taking the measured data by the calculated scale. And the scale is determined by dividing 80 mm on the palette by the distance measured with a millimeter ruler on the computer screen in 40 cells.
Measurement of the left and right halves of birch leaves
From the beginning of ontogenesis on May 1, 2021, out of 25 registered leaves, 4 birch leaves reached 163 days before falling off (until October 10, 2021); 11 sheets - 156 days (03.10.2021); 1 - 149; 1 - 142; 1 - 135; 3 - 100 and 4 - 79 days.
Note: the maximum values of 12 morphological features are highlighted in bold.
Table 1 shows that the maximum and minimum values of the selected distinctive morpho-logical features are located in the ontogeny time interval from 44 to 163 days. Only the corner of the left half of the sheet is located at the maximum on the border. This fact means that measurements had to be started on May 31.
Table 2 shows the indicators of asymmetry for the accounting sheet No. 1-3.
The following conventions are adopted here:
Table 1: Data of morphological characteristics according to the accounting sheet No. 1-3 of birch.
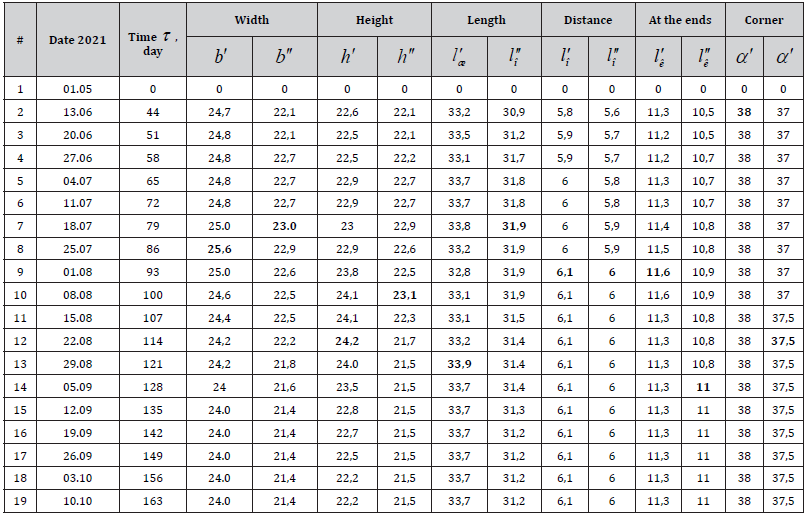
Table 2:Absolute and relative asymmetries for birch leaf No. 1-3.

A – absolute asymmetry of the left from the right side of the
sheet, A = y′ − y′′ ;
o – relative asymmetry calculated by the formula
o =100A/( y′ + y′′) , %.
The sign + A will always show left-sided asymmetry, and with the sign − A there will be right-sided asymmetry of the birch count sheet. The dynamics of ontogenesis is characterized by the fact that each leaf during the growing season can switch several times from left-sided to right-sided asymmetry and vice versa. The dimension of relative asymmetry in percent gives advantages in calculations and visibility.
In the method of V.M. Zakharov [12] does not take into account the sign of the difference between the values of the left and right halves of all 100 leaves taken at a time. For each accounting sheet of birch, such a simplification is incorrect. Moreover, it is the transitions from the left to the right halves and back along the asymmetry that are taken into account when accepting the mathematical signs “+” and “-”.
Note: Bold indicates maximum values; the last three morphological features show that the start of measurements should be on May 31st.
General relative asymmetry O = f (τ ) , taking into account the signs, according to 12 mor-phological features (six left and six right sides of the sheet) is calculated by the formula

This physical quantity becomes a characteristic of the behavior of each birch leaf in the dynamics of ontogeny from bud break to leaf fall.
General asymmetric wavelet for modeling the dynamics of onogenesis
In nature, all processes occur according to the wave equations of oscilla-tory adaptation according to the general formula of the quantum of behavior [15-19] in the form of an asymmetric wavelet

where y – is the indicator (dependent factor), i – is the number of the component (2) or quantum of the system behavior, m – is the number of members (quanta) in the model (2), – is the explanatory variable, a1...a8 – are the parameters of each member of the model (2); Ai – is the variable amplitude (half) of the asymmetric wavelet, pi – is the variable half-cycle of the oscillation.
Formula (2) contains two fundamental physical constants: e (Napier number or time num-ber) and π (Archimedes number or space number). Then, according to the wavelet (2), a quantized wavelet signal is formed inside the process under study. Behavior quanta appear sequentially by the method of identification. The concept of a wavelet signal makes it possible to abstract from the physical meaning of many statistical series of measurements and consider their additive decomposition into components in the form of a sum of individual wavelets (quanta of behavior) of the system.
A signal is a material carrier of information. And we understand information as a measure of interaction. In our case, this is the reaction of the birch count sheet to external influences from the parameters of the microenvironment around the leaf and the terrain parameters. A signal can be generated by each leaf, but its reception has not yet been carried out. In the fu-ture, with the help of miniature devices suspended near the accounting sheet, the values of the parameters of the birch leaf and its environment will be automatically recorded every hour.
Results And Discussion
We propose a method for photoindication of birch leaves without cutting them [13,20-26], that is, in the growing state, and for the entire growing season according to the parameters in Figure 1.
Distribution of asymmetry by fluctuations in the growing season
The relative fluctuating asymmetry of 12 morphological parameters of birch leaves during the growing season is considered as an oscillatory adaptation of each record sheet to changes in the external environment surrounding this leaf. Moreover, the oscillatory adaptation occurs in at least six wavelets, that is, the behavior of the birch registration sheet can be decomposed into at least six behavioral quanta. This indicates a very high plasticity of the vital activity of birch leaves. In our opinion, over 180 million years of evolution, the birch has “learned” to adapt to any changes in climate, weather, and the influence of environmental objects.
All 25 accounting birch leaves were divided according to the
nature of their behavior, in the course of oscillatory adaptation in
the ontogeny period of 2021, into the following groups:
1) left asymmetry, when the left side of the birch leaf is
predominant;
2) tendency of birch leaf by fluctuation from left to right
asymmetry;
3) transition from left to right asymmetry (through relative
symmetry 0);
4) transition from right to left asymmetry;
5) tendency of birch leaf by fluctuation from right to left
symmetry;
6) right asymmetry, the right side of the sheet is predominant.
Let us consider the nature of fluctuations of relative asymmetry in the count birch leaf in each group: group 1 - 7 count leaves; 2 - 3 sheets; 3 - 4 sheets; 4 - 2 sheets; 5 - 2 sheets; 6 - 7 sheets. The extreme asymmetries (left and right) turned out to be the same in terms of the number of counted leaves. The intermediate four groups make up 11 leaves or 44%.
Tables 3 and Table 4 show data on the general relative asymmetries O = f (τ ) for accounting birch leaves with a growing season of 163 to 135 days (18 pieces or sample representativeness is 72%). They are divided into groups as follows: 1 group - 4 registration sheets; 2 - 1 sheet; 3 - 3 sheets; 4 - 2 sheets; 5 - 2 sheets; 6 - 6 accounting sheets.
Table 3:General relative asymmetry of birch leaves with left asymmetry.

Table 4:General relative asymmetry of accounting birch leaves with right asymmetry.

The regularities of fluctuation dynamics (oscillatory adaptation) are revealed by the meth-od of identifying the parameters of the general formula of asymmetric oscillation (2). Due to the small volume of the article, the quanta of the behavior of only six leaves are given below, one from each group.
Patterns of fluctuations in the left asymmetry of birch leaves
Table 5:Parameters (2) of ontogeny dynamics for general left relative asymmetry

Table 5 shows the parameters of the model (2) identified by the computational capabilities of the CurveExpert-1.40 software environment (the first four terms together). The overall correlation coefficient of the four components in the representative of the first group is 0.9960, which indicates a high level of adequacy of the identified model (2). The remaining three wavelets for sheet #1-3 also have a high adequacy.
The first component shows the natural process of development and growth of the birch leaflet from the beginning of bud break. Here, a leaf from the first group receives a power function, which indicates the start of ontogeny exactly from the date 05/01/2021.
A birch leaf from the second group according to the trend
receives inhibition of the growth process, that is, a biotechnical law
as a mixture containing two laws:
1) power function;
2) modified Mandelbrot’s law O = a exp(−bτ c ) under the
condition c ≠1.
The law of Mendelbrot’s fractal distribution under the condition c =1 has the form O = a exp(−bτ ) . The same law in mathematics is called the Laplace law, in biology - the Pearl-Zipf law, in econometrics - the Pareto law. Physically, it turns out that the quanta of the behavior of the birch count sheet are themselves distributed according to the Mandelbrot law.
The representative of the third group, as well as in the second one, has a trend in the form of the biotechnical law of prof. P.M. Mazurkin [17].
The signs in front of the components show the nature of the asymmetry. The sign “+” shows the wavelet directed to the left asymmetry of the accounting sheet, and “-” - to the right.
Next, consider three representatives of the left asymmetry.
Left-sided asymmetry and fluctuation in the growing season Left asymmetry. Graphs of the first five terms of the model (2) according to Table 5 are shown in Figure 2.
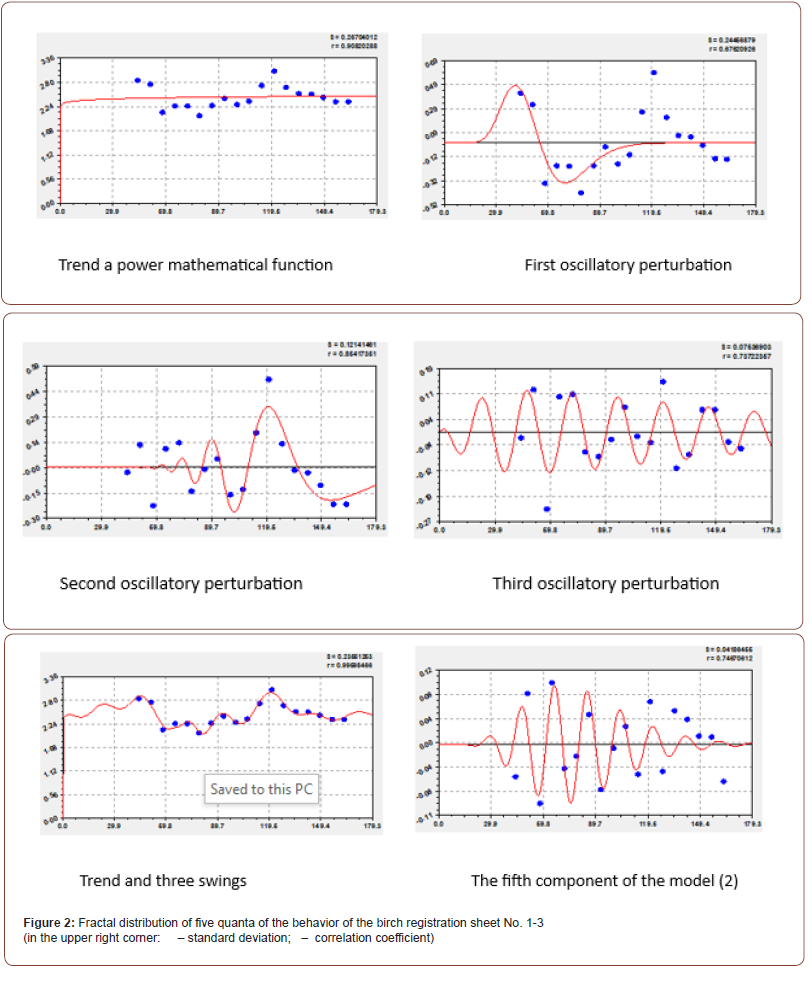
As can be seen from the figure, it is the trend that determines the nature of each of the six groups of accounting birch leaves. This fact means that the asymmetry in the dynamics of on-togeny mainly manifests itself as a non-linear trend, and the fluctuation of the asymmetry manifests itself through several wave equations (asymmetric wavelets). It is the wavelets that show the influence of external phenotypic traits on the development and growth of the birch registration sheet.
It turned out that the trend in the form of a power function shows the rapid achievement of the maximum left-sided asymmetry by the accounting sheet No. 1-3. Although the process of ontogeny during the growing season becomes understandable, the reasons for such complex behavior in asymmetric wavelets remain unclear in the “count sheet - environment” system.
Therefore, in subsequent experiments, it is necessary to carry out measurements near each registration sheet: 1) external parameters that affect the process of photosynthesis (illumina-tion, temperature, humidity, pressure, etc.); 2) external parameters that determine pollution in the air microenvironment of the registration sheet (azimuth of the leaf relative to the trunk, the distance of the leaf from the vertical axis of the birch, height above the soil, distance from the edge of the road, traffic intensity, etc.).
Components 2, 4 and 7 from Table 5, although they direct the birch count sheet to the right asymmetry, however, they cannot resist the trend together with components 4, 5 and 6.
Rotation from left-sided to right-sided asymmetry. Here (Figure 3) the trend itself has a deceleration (biotechnical law) and a turn towards the right asymmetry. The biotechnical law combines two actions: on the one hand, it shows the growth of a power-law mathematical function; on the other hand, this growth is opposed by a decrease in the values of the birch leaf parameter according to the Mandelbrot law. In biological processes, both of these tendencies exist together and occur simultaneously.
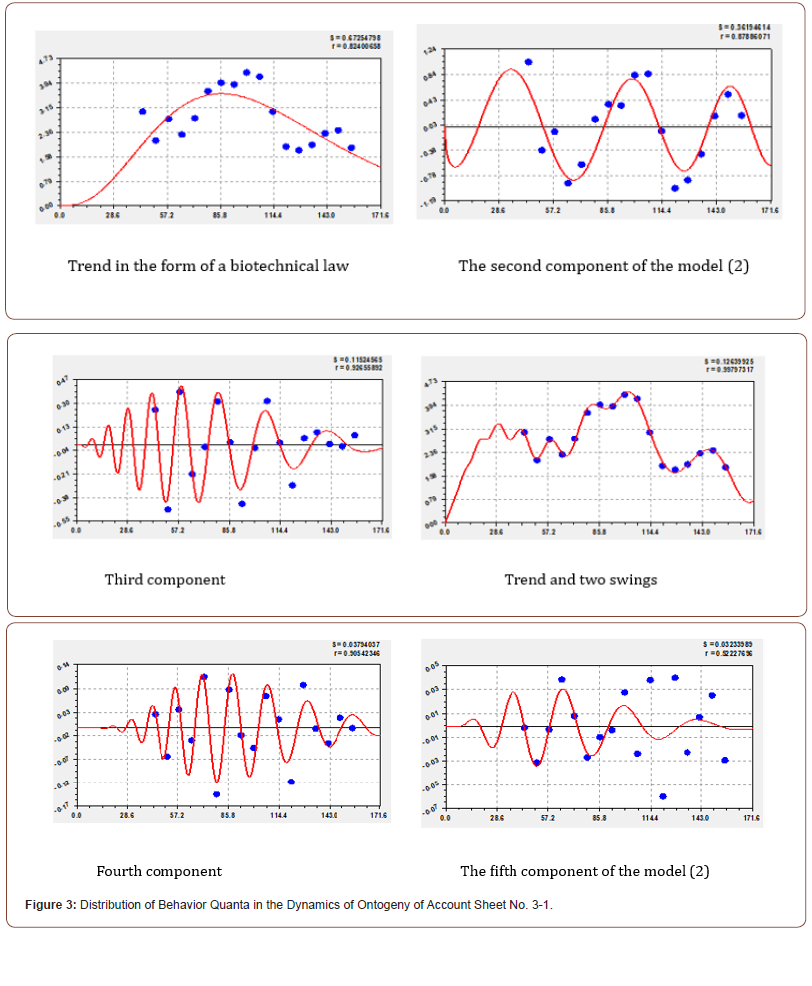
This fact means only one thing, that the trend itself depends on the trajectory of changes in the relative asymmetry of the birch count sheet, and fluctuations only have an additional effect on the process of adapting its behavior to the parameters of the external environment [27].
Graphs of fluctuations in the growing season are more calm. All oscillations, including wavelets of left-sided asymmetry No. 3-1 (Table 5), have amplitude maxima within the grow-ing season, and the half-period of oscillations (except for the more frequent component No. 2) calms down with an increase in the half-period of oscillation.
Fluctuation transition from left to right asymmetry. The graphs of the first four components of the model (2) according to Table 5 are shown in Figure 4, and the graphs of the remaining four components are shown in Figure 5.

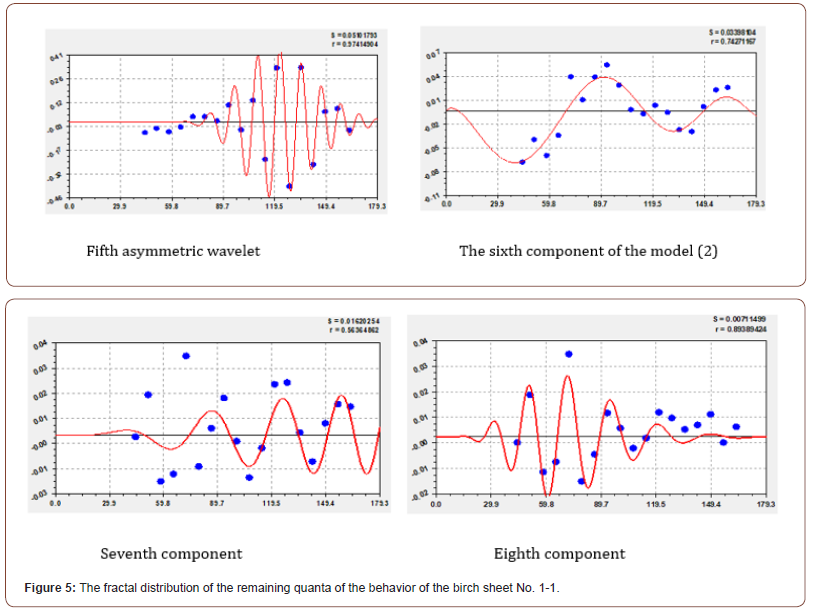
As can be seen from Figure 3, the trend is formed from two laws: the first component is the Mandelbrot law modified by us; the second component in the form of a negative biotenic law shows a complex picture of the transition to the right asymmetry.
There is also a trend (but already a two-component one) that receives a decisive influence. Fluctuations, as in the first two cases, receive only an auxiliary adaptive value. However, the two subsequent fluctuations are oriented to the left side of the leaf, so the general graph (Figure 4) shows the further development of leftsided asymmetry.
It is noticeable that the number of components of the general model (2) increases at the transition between asymmetries.
Regularities of fluctuations on right-sided asymmetry
Models of ontogeny. The weights of three representatives of the groups of accounting leaves of drooping birch with right-sided asymmetry have a negative sign in front of the trend equation (Table 6) according to the biotechnical law.
It is interesting to note the dynamics of the ontogeny of birch record sheet No. 5-2 with right-sided asymmetry, when the constant period of oscillation of the first wave (the second term) is 2 17.78714 35.6 days. This period of oscillation in the lunar cycle is equal to five weeks.
Table 6:Parameters (2) of the dynamics of ontogeny for the general right relative asymmetry.

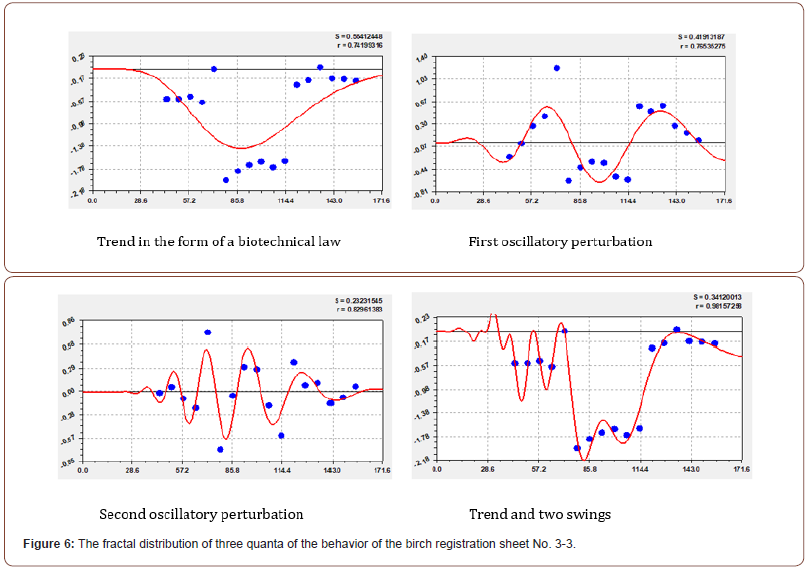
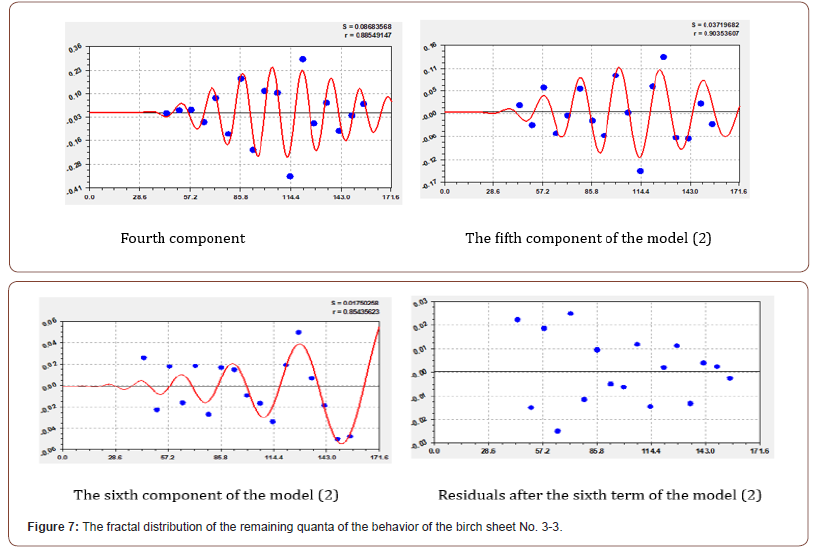
Fluctuation transition from right to left asymmetry. Here (Figure 6 and Figure 7) there are two attempts to return the right to the left asymmetry. The trend in the form of a negative biotechnical law shows (see dot plot) that already in the growing season of 72 days it was possible to move to the upper part of the rectangular coordinate system.
The trend shows an increase in the right asymmetry, but then there is a slowdown according to the modified Mandelbrot law. The graph is rotated towards the x-axis. The first and second fluctuations occur with an increasing period, that is, the oscillatory adaptation calms down. The correlation coefficient of the three terms of the model (2) reaches 0.9816. According to the level of adequacy (Mazurkin, 2014a), the model becomes a superstrong connection. The remaining three asymmetric wavelets complement the adequacy to almost 1.
It turns out that each leaf behaves individually asymmetrically and falls into one of six scenarios of behavior. In total, all leaves on one birch, as well as all leaves on all birches of the Northern Hemisphere of the Earth, on average, behave symmetrically in the field. This mani-fests the nature of the behavior of the individual and the entire population.
In height and azimuth, there are changes in the parameters of the leaves on the birch tree.
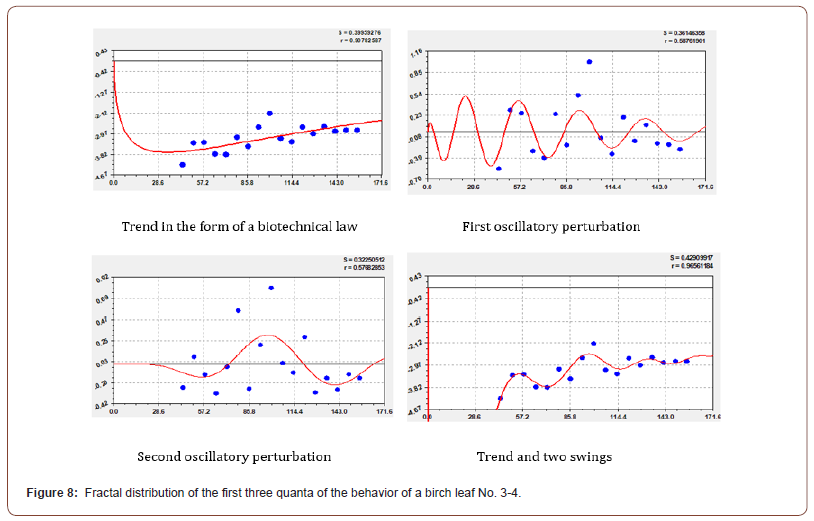
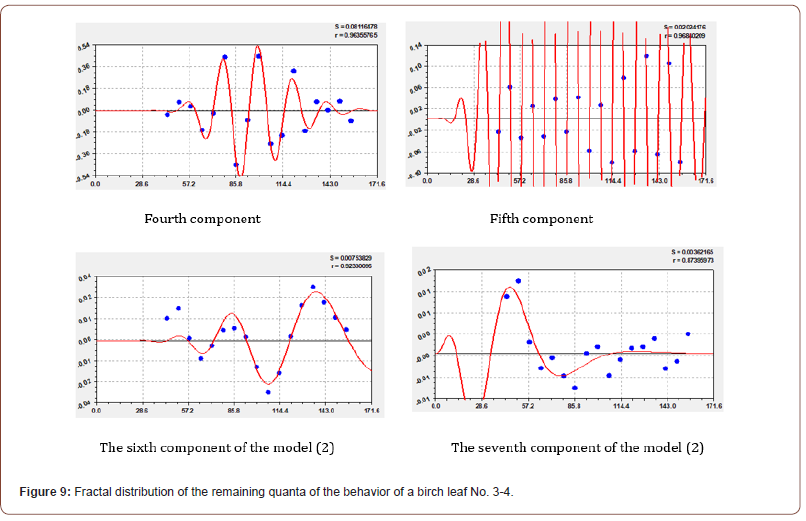
Rotation of fluctuation from right to left-sided asymmetry. Graphs of all seven members of the model (2) according to Table 6 are shown in Figures 8 and 9.
According to the trend, the sheet first goes to the right side, then returns to the x-axis. However, during the growing season, birch leaf No. 3-4 will not reach zero, that is, this birch leaf has not reached symmetry (it will be on the abscissa axis).
Right-sided asymmetry and fluctuation in ontogeny. Graphs of the six compo-nents of the general model (2) according to Table 6 and the residuals are shown in Figures 10 and 11.
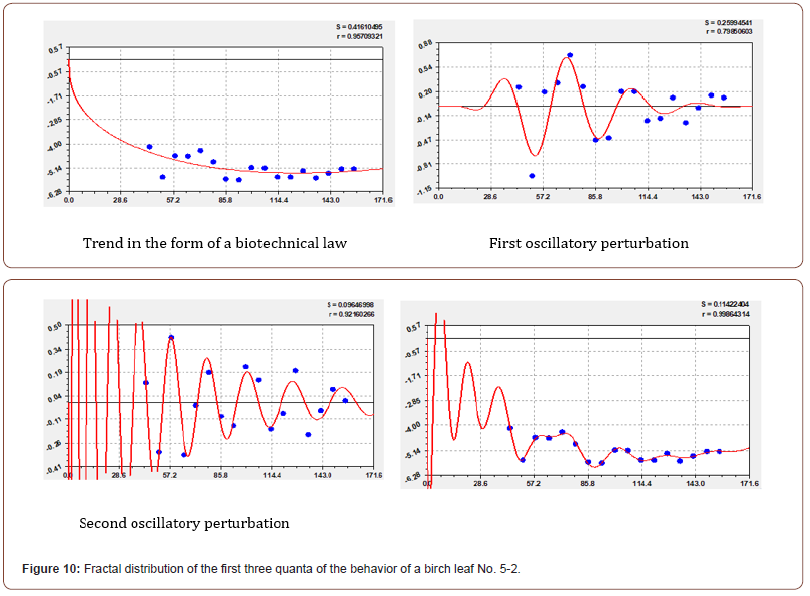
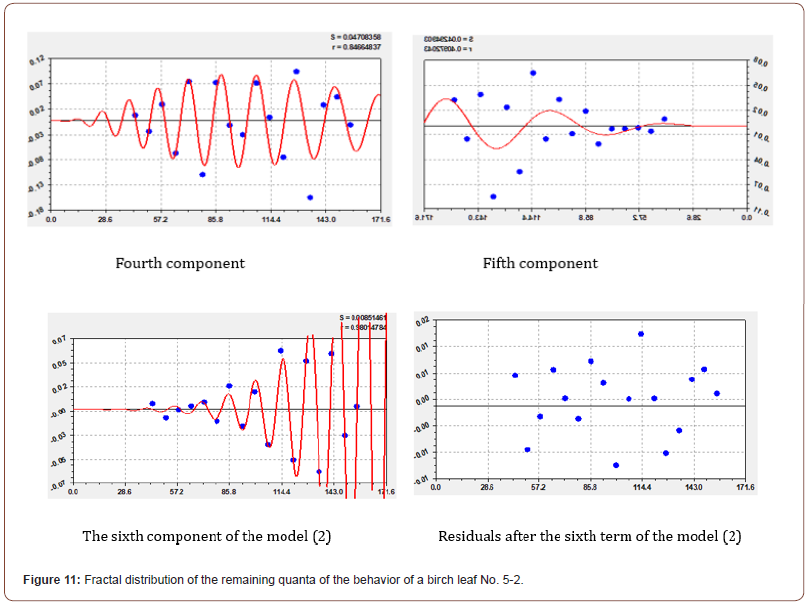
Trand shows the desire for the constancy of the relative rightsided asymmetry. However, the oscillatory adaptation graphs have a strong fluctuation.
Modeling error by identifying asymmetric wavelets
The error of sequential modeling of the wavelet signal (2) is estimated in Table 7 by the residuals from six to eight components of the model with parameters from Tables 5 and 6.
The maximum relative error of -5.45% for accounting sheet No. 3-3 is obtained due to the close location of the relative asymmetry -0.0045% near the abscissa axis. The remainder (the difference between the actual and calculated values according to the model) is only 0.0259108%. Similarly, for this sheet, as of September 12, 2021, the relative modeling error was -4.96% with the actual value of the relative asymmetry of 0.0315% and the value calcu-lated using the formulas from Table 6 -0.0144567%.
Then it turns out that the wavelet analysis of the behavior of each birch count sheet gives a reliable picture of the process of oscillatory adaptation in the second part of the growing sea-son (after 44 days). The minimum relative modeling error according to Table 7 is only 0.15% for accounting sheet No. 3-4. It turns out that the oscillatory adaptation of the behavior of a birch leaf is performed with several fluctuations (6-8 asymmetric wavelet signals).
Table 7:Model error (2) for selected birch sheets.

Conclusion
The relative fluctuating asymmetry of the morphological parameters of birch leaves (Betu-la pendula) during the growing season is considered as an oscillatory adaptation of each accounting birch leaf to changes in the external environment surrounding this leaf. On the terri-tory of Yoshkar-Ola, oscillatory adaptation occurs in at least six wavelets, that is, leaf ontoge-ny can be decomposed into at least six behavior quanta. This indicates a very high plasticity of the vital activity of birch leaves.
All measured 25 accounting birch leaves were divided according
to the nature of their be-havior during oscillatory adaptation in
ontogeny in 2021 into the following groups:
1) left asymmetry, when the left side of the birch count sheet is
predominant;
2) the desire of the birch count sheet to fluctuate from left to
right asymmetry;
3) transition from left to right asymmetry (through relative
symmetry equal to 0);
4) transition from right to left asymmetry;
5) tendency of birch count sheet by fluctuation from right to
left symmetry;
6) right asymmetry, the right side of the birch leaf is
predominant.
Each accounting birch leaf has its own behavior. New leaf parameters were introduced: absolute asymmetry of the birch leaf sides; relative asymmetry, %. In this case, the “+” sign will show left-sided asymmetry, and with the “-” sign, there will be right-sided asymmetry of the birch accounting sheet. The dynamics of ontogeny is characterized by the fact that each birch leaf during the growing season can several times move from left to right asymmetry and vice versa.
Regularities of fluctuation dynamics (oscillatory adaptation) are revealed by the method of identifying the general formula of asymmetric fluctuation (2). The model parameters (2), identified by the computational capabilities of the CurveExpert-1.40 software environment, give an overall correlation coefficient of at least 0.9656, which indicates a high level of ade-quacy of at least 0.95 (super strong connection). The first component points to the natural pro-cess of development and growth of the birch count sheet from the beginning of bud break. The signs in front of the components show the nature of the asymmetry. The sign “+” shows the wavelet directed to the left asymmetry of the birch count sheet, and “-” - to the right. Regularities of fluctuation dynamics (oscillatory adaptation) are revealed by the method of identifying the general formula of asymmetric fluctuation (2). The model parameters (2), identified by the computational capabilities of the CurveExpert-1.40 software environment, give an overall correlation coefficient of at least 0.9656, which indicates a high level of adequacy of at least 0.95 (super strong connection). The first component points to the natural process of development and growth of the birch count sheet from the beginning of bud break. The signs in front of the components show the nature of the asymmetry. The sign “+” shows the wavelet directed to the left asymmetry of the birch count sheet, and “-” - to the right.
Acknowledgement
None.
Conflict of Interest
None.
References
- Takhtajan AL (1970) Origin and distribution of flowering plants. L.: Publishing house "Nauka", Leningrad. Otdel. 147c.
- Takhtajan AL (1986) Floristic regions of the world. The Regents of the University of Califor-nia p. 523.
- Urazgildin RV, Kulagin AY (2021) Technogenesis and structural-functional reactions of tree species: damage, adaptations, strategies. Part 1. Influence on the macro- and micromorphology of the assimilation apparatus. Interdisciplinary scientific and applied journal "Biosphere" 13(3): 86-100.
- Erofeeva EA (2012) Stability of Pisum Sativum L. leaf development under the action of for-maldehyde in a wide range of doses. Ontogenesis 43(5): 320-324.
- Karmanova TN, Feoktistova NY, Fetisova EA, Mosalov AA, Surov AV, et al. (2021) Ecology of the city: retrospective and perspectives of study. Journal of General Biology 82(3): 163174.
- Mazurkin PM (2018) (a) Ecological methods for assessing the quality of the environment by fluctuating asymmetry of birch leaves. Scientific Review. Biological Sciences 5: 15-21.
- Shmelev IA, Shmelev SE (2019) Global cities: multi-criteria assessment of sustainable development. Interdisciplinary scientific and applied journal "Biosfera" 11(1): 1-18.
- Schnelle F (1961) Phenology of plants: Per. from the German. L. Gidrometeoizd p. 260.
- Uranov AA (1964) Observation in summer practice in botany: A guide for students (2nd Edn), revised. and additional Moscow: Education p. 216.
- Vasfilov SP (2015) Influence of photosynthesis parameters on leaf lifespan.
- Bogolyubov AS (2002) Assessment of the ecological state of the forest by the asymmetry of the leaves. M.: Ecosystem p. 10.
- Zakharov VM, Chubinishvili AT, Dmitriev SG, Baranov AS, Borisov VI, et al. (2000) Environmental health: assessment practice. M.: Center for Environmental Policy of Russia p. 320.
- Mazurkin PM, Kudryashova AI (2015) (a) Dynamics of tree leaf ontogeny. Yoshkar-Ola: Pov-olzhsky GTU p. 172.
- Tokareva NI, Mazurkin PM (2021) The method of photodynamics of the vegetation of birch leaves. Youth - for a clean Volga: Sat. scientific works and environmental projects Vseross. youth scientific and educational festival. Cheboksary: Ed. House "Sreda" pp. 317-323.
- Mazurkin PM (2014) (b) Identification of the wave patterns of behavior. 14th International multidisciplinary scientific geoconferenct & SGEM2014. GeoConference jn nano, bio and green – technologies for a sustainable future. Conference proceedincs (Scopus) Vol. 1. Section Advances in Biotechnology. Albena, Bulgaria pp. 373-380.
- Mazurkin PM (2015) (c) Invariants of the Hilbert Transform for 23-Hilbert Problem. Advances in Sciences and Humanities 1(1): 1-12.
- Mazurkin PM (2014) (d) Method of identification. 14th International multidiscipli-nary scientific geoconferenct & SGEM2014. GeoConference jn nano, bio and green – tech-nologies for a sustainable future. Conference proceedincs (Scopus). Vol. 1. Section Ad-vances in Biotechnology. Albena, Bulgaria pp. 427-434.
- Mazurkin PM (2015) (e) Method for identifying regularities. Uniform All-Russian Scientific Bulletin 1: 98-105.
- Mazurkin PM (2016) (f) Statistical identification of dynamics series. Bulletin of world science. Series "Economics" 1: 79-96.
- Mazurkin PM, Kudryashova AI (2019) (b) Factor analysis of meteoparameterson the stage of growth of birch leaves. International Journal of Current Research 11(10): 7774-7779.
- Mazurkin PM, Kudryashova AI (2018) (c) Fito Urban Meteorology: Influence of the Amount of the Temperature on the Ontogeny of the Leaves of the Silver Birch. J. Basic Sci. Appl. Res. 4(2): 1-15.
- Mazurkin PM, Kudryashova AI (2018) (d) Fito meteorologiya City: The Influence of the Amount of Relative Humidity of Air Ontogenesis Leaves of Birch. J. Basic Sci. Appl. Res. 4(1): 1-15.
- Mazurkin PM, Kudryashova AI (2018) (e) Method of measurement of dynamics of growth of leaves of the tree in clean ecological conditions. International Multidisciplinary Scientific GeoConference Surveying Geology and Mining Ecology Management, SGEM 18(5.1): 517-524.
- Mazurkin PM, Kudryashova AI (2019) (f) Patterns of phytoindication pollution of the urban environment the maximum width of the leaves of the silver birch. Journal of Chemical, Bio-logical and Physical Sciences (J. Chem. Bio. Phy. Sci). Sec. D 9: 3.
- Mazurkin PM, Kudryashova AI (2019) (g) Quantum fitometeorology. International Multidisciplinary Scientific GeoConference Surveying Geology and Mining Ecology Management, SGEM 19(5.1): 609-617.
- Mazurkin PM, Kudryashova AI (2018) (h) Wave dynamics of ontogenesis of leaves around automobile road. International Multidisciplinary Scientific GeoConference Surveying Geology and Mining Ecology Management, SGEM 18(5.1): 1023-1030.
- Mazurkin PM (2015) (g) Wavelet Analysis Statistical Data. Advances in Sciences and Humani-ties 1(2): 30-44.
-
P. M. Mazurkin*. Dynamics of Ontogenesis in The Phytosphere: Fluctuation of the Asymmetry of The Birch Leaf (Betula Pendula). Annal Biostat & Biomed Appli. 5(3): 2023. ABBA.MS.ID.000614.
Birch, Leaves, Ontogeny, Morphoparameters, Dynamics, Patterns, Methodology, Photodynamics, Asymmetry
-

This work is licensed under a Creative Commons Attribution-NonCommercial 4.0 International License.


