


 Research Article
Algorithmic Methodologies of Performance and Prediction Application to Medically Assisted Procreation
Received Date:February 15, 2025; Published Date:February 25, 2025
Abstract
Despite the evolution of assisted procreation medical techniques, the success rate of the positive pregnancy event (Gr +) is considered to be low by specialists. The scientific originality that will be presented in this article is centered on the elaboration of an algorithm of prediction based in others on the Multiple and Binary Logistic Regression; This in order to highlight the presence or absence of the pregnancy event. It is clear that this mode of regression is widespread for predictive purposes. Indeed, we can cite the fields of uses in a non-exhaustive way: medicine, insurance, banking, transport, econometrics etc. The data that will be used to lead this study are transcriptomic optical intensities of fluorescent genes. This used data is obtain from a physical system of type qPCR (Polymerase Chain Reaction). The scientific lock consists in analyzing the criterion of performance, namely logistic regression and to optimize Likelihood in order to maximize the probability that the test is revealing or not of the Gr + event. of course, this will be done by analyzing in parallel the Odds-Ratio (OR). In summary, our aim is to develop an algorithm capable of generating a reliable model (s) in terms of discrimination using the quantities mentioned before. At threshold 0.5, performance characteristics will be given: ROC curve, area under ROC curve (AUC), Sensitivity (Se), Specificity (Sp), confusion table and likelihood. Finally, we conclude on the algorithmic relevance in term of discrimination, classification and finally validation.
Keywords:Assisted procreation medical techniques; pregnancy (Gr+); algorithm of prediction; multiple and binary logistic regression; transcriptomics; gene; polymerase chain reaction qPCR; performance; likelihood; odds-ratio (OR); ROC curve; area under curve AUC; sensitivity; specificity; discrimination; validation
Introduction
Logistic regression is one of the most commonly used multivariate analysis models for predictor the explanatory variables integrated into the regression model is based on prior knowledge of medical pathophysiology. And also, on the statistical association between the variable and the event measured by the Odds-Ratio [1,3,4,14,16] is very well suited to the analysis of our transcriptomic data (qPCR: N Cumulus, 21 genes) [6,13], since the variable to be explained Y takes Only two modalities: Positive pregnancy (Gr or 1), or negative (Gr- or 0). It is random, binary, categorical and dependent. It follows the binomial probability distribution with parameters (N,π ) . This random variable is formulated as follows:
It is a vector to predict at best by maximizing the likelihood [2,5,8,9,12] that will be discussed later. As for the explanatory variable X , it actually represents data of the biomarker expressions of the used genes. It is expressed in our case in matrix from as follows:
The lines of X represent the cumulus of the patients used (N lines). The columns correspond to the genes used (P columns). Model the dependence of Y as a function of the descriptive matrix X according to the following matrix equation:
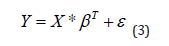
Is equivalent to establish an optimum algorithm, generating a
predictor model β∧ obtained by optimizing the criterion of the Log
of the criterion Likelihood [5,8,16,18].
With:
X is the descriptive matrix ∈RN.RP+1.
β is the predictor vector ∈RN.
ε is the residual error following a normal distribution defined
on the space Ω (0,σ2) of zero mean and of variance =σ2.
Performance and Likelihood Study
In this article, we focus on measuring the performance of ROC among others, with the aim of achieving the different performance characteristics, establishment. It allows to measure the association between the occurrence of an event (explanatory and qualitative variable X ) and the factors likely to influence it (explanatory variables = X ). The choice of namely sensitivity and anti-specificity, of putting a true positive in front of a false positive. The knowledge of the number of True Positive (VP), True Negative (VN), False Positive (FP), and finally False Negative (FN) allows us to evaluate the sensitivity Se such that Se = VP / VP + FN), and the specificity Sp such that Sp = VN / (VN + FP) for a threshold of 0.5 These parameters make it possible to evaluate the performance and hence the quality of the models used [7,10,11,17].
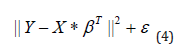
Our objective is to find the optimum coefficients β ∧ of the predictor Y which minimizes the following residuals:
The optimum predictor Yi of our model Y is obtained by maximizing the Log of the Likelihood L_N whose equation is
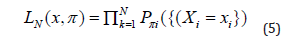
With x=(x1,x2,...,xN) statistical realization-sample of the matrix X=(X1,X2,...,XN) , which depends on the probability π={π1,π2,...,πN} with πiis estimated to P* ∀i . P* represents the probability of observing the event Y =1(vs.0) .
The optimization process is not linear, hence the use of the Logit transformation (Link function). It is given by the following formula:
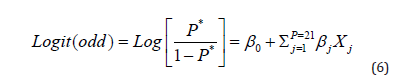
This function Logit (formula 6) is bijective and differentiable, thus transforming the binary space [0, 1] to the real space ]−∞,+∞[.
The predicted probability is thus written as follows:
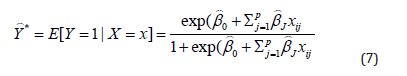
In this case, it is assumed that the observations are independent and no hypothesis on the variance. Note also the absence of the error term.
Note: To obtain the Maximum of Likelihood, a Log of 𝑳𝒐𝒈(𝑳𝑵) is derived.
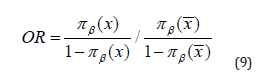
This optimization leads us to the optimal predictor coefficient vector β , and consequently the vector Odd-Ratio OR tq:

When the predicted probability is close to 0.5, it will be difficult to discriminate. When β increases one discriminates better. Such an interpretation depends on the values of X (according to its scale), which is why, and in general, the interpretation of the coefficients β is done with the Odds-Ratio (OR) [4,5,8,12].
Odds-Ratio (OR)
The general idea is to reason in terms of probability, using the ratings (Cote = Chance). The OR operates on the basis of the dimensioning principle, that is, it measures the relationship between the score of an event occurring in a group of individuals A and the rating of the same event occurring in group of Individuals B. OR is a tool often used in the area of performance appraisal. They are used to measure the effect as the contrast (or strength) of the Matrix X [1,3,5,9]. The Odds Ratio depends on the predictor vector β. The expression of the OR parameter is formulated as follows:
Algorithms

Result of Performance. ROC curves
The OCR curve has emerged as a mathematical tool for quantifying the performance and therefore the quality of a Predictive Model. It often appears as a function of the Rate of Positive (fraction actually detected) as a function of the Rate of Positive False (fraction incorrectly detected). Graphically, the ROC curve is presented as Sensitivity = F(Anti-Specificity) see (Figure 1), which shows the ROC curves of our Model, the learning model and the Test curve; The latter two models have been developed for validation purposes. The AUC of the Full Model is 0.788148 (Red Curve), the AUC of the Learning Model is 0.70977 (Blue Curve), and that of the Test Model is of 0.933333 (Green Curve). In the best of cases, the AUC is equal to 1.
Reviews
The area under the ROC curve of the complete model is 0.79. If it was an AUC of about 0.9, it looks like this model is almost quasi- perfect. There is a 20% residual difference between this model and the perfect model (AUC = 1). Therefore, this model is critical for the correct discrimination.
Hypothesis
ROC performance is necessary but not sufficient to give effective judgment in terms of discrimination?

Discussion
To answer this question, we will analyse the probabilities predicted by the logistic regression, as well as the parameter of the dimensions (OR). It must be said that this analysis aims to reinforce or not the hypothesis announced previously.
Probability Predicted and Observed
Figure 2 shows the probability of the predictor β (blue discontinuous curve), its Spline-Cubic interpolator, and the binary Y variable observed (small black circles).

Curve of ORs
Below Figure 3, the curves ORs are given according to the 21 genes and their IC (Confidence Interval): The values of the OR parameter (black curve) belong to the confidence interval. Fluctuations in CI are always close to 1. Therefore, it is a biased model with very little discrimination.

Conclusion
It can be said that the results lean towards a model that is not very discriminating in terms of performance and Odd-Ratio. The ROC curve indicates that the AUC is 0.78, so far from the perfectly discriminating model of about 20%. The OR of this model is close to 1, it is very informative in terms of qualities required for a diagnostic test. It can therefore be deduced that these data do not allow the achievement of a model that discriminates in the absolute sense, despite the relatively near-acceptable performance. The data used do not provide an exploitable model. ROC performance alone, as a criterion for judging the quality of the test is necessary but not sufficient. The power of the diagnostic test is very low to draw a positive conclusion with regard to the biomarker genes used.
References
- Anselme B (2015) Biomathematics: Tools, methods and examples. Collection: Sciences Sup Dunod pp. 352.
- Akaike H (1973) Information theory and an extension of the maximum likelihood principle. Second International Symposium on Information Theory pp. 267-281.
- Bagley SC, White H, Golomb BA (2001) Logistic regression in the medical literature: standards for use and reporting, with particular attention to one medical domain. J Clin Epidemiol 54(10): 979-985.
- Baraud Y (2000) Model selection for regression on a fixed design. Probability Theory and Related Fields 117: 467-493.
- Besse P (1996) DATA Mining II. Modeling Statistics & Learning. 9. Pedagogical document of the L.S.P., University Toulouse III. DE. Birch, Simplifed hot start PCR. Nature 381: 445-446.
- Birch DE (1996) Simplified hot start PCR. Nature 381: 445-446.
- Centor RM, Schwartz JS (1985) An evaluation of methods for estimating the area under the receiver operating characteristic (ROC) curve. Med Decis Making 5(2): 149-156.
- Charrier C (2011) Modélisation statistique et classification par apprentissage pour la qualité des images. Treatment des images. Université de Caen.
- Falissard B (2005) Comprendre et utilizer les statistiques dans les sciences de la vie. 3rd ed. Paris: Masson PP. 380.
- Hajian-Tilaki KO, Hanley JA (2002) Comparison of three methods for estimation the standard error of the area under the curve in ROC analysis of quantitative data. Acad Radiol 9(11): 1278-1285.
- Hanley JA (1989) Receiver Operating Characteristic (ROC) methodology: the state of the art. Crit Rev Diagn imaging 29(3): 307-335.
- Hastie T, Tibshirani R, Friedman J (2001) The elements of statistical learning - Data Mining, Inference and Prediction. Springer.
- Heid CA, Stevens J, Livak KJ, Williams PM (1996) Real time quantitative PCR. Genome Res 6(10): 986-994.
- Hosmer DW, Lemeshow S (2000) Applied Logistic Regression. Wiley pp. 392.
- Kumar R, Indrayan A (2011) Receiver operating characteristic (ROC) curve for medical researchers. Indian Pediatr 48(4): 277-289.
- LaValley MP (2008) Logistic Regression. Circulation 117: 2395-2399.
- Linden A (2006) Measuring diagnostic and predictive accuracy in disease management: an introduction to receiver operating characteristic (ROC) analysis. J Eval Clin Pract 12(2): 132-139.
- Ottenbacher KJ, Ottenbacher HR, Tooth L, Ostir GV (2004) A review of two journals found that articles using multivariable logistic regression frequently did not report commonly recommended assumptions. J Clin Epidemiol 57(11): 1147-1152.
-

This work is licensed under a Creative Commons Attribution-NonCommercial 4.0 International License.


